Hi, I am Cédric 👋
I assist organizations, research teams, and businesses in effectively communicating insights through engaging data visualizations and graphical storytelling.
Schedule a discovery call!
As an independent data visualization specialist, I combine my analytical research expertise and programing skills with my passion for design, colors, and typefaces. I have designed data visualizations across all disciplines, purposes, and styles ranging from custom, data-driven designs to automated reporting.
As a graduated ecologist, I have acquired an extensive hypothesis–driven research experience and problem–solving expertise in data wrangling, statistical analysis, and model development. Since communicating data effectively is of paramount importance, I have subsequently developed my skills in data visualization, design, and data journalism.
By applying a code–first approach, I ensure reproducible and efficient workflows to create all kind of data products such as static and interactive visualizations, dynamic reports, and web applications.
I frequently engage as a workshop trainer and speaker on topics such as effective and engaging data visualization design, code-driven graphics with {ggplot2}, and reproducible data science workflows in R.
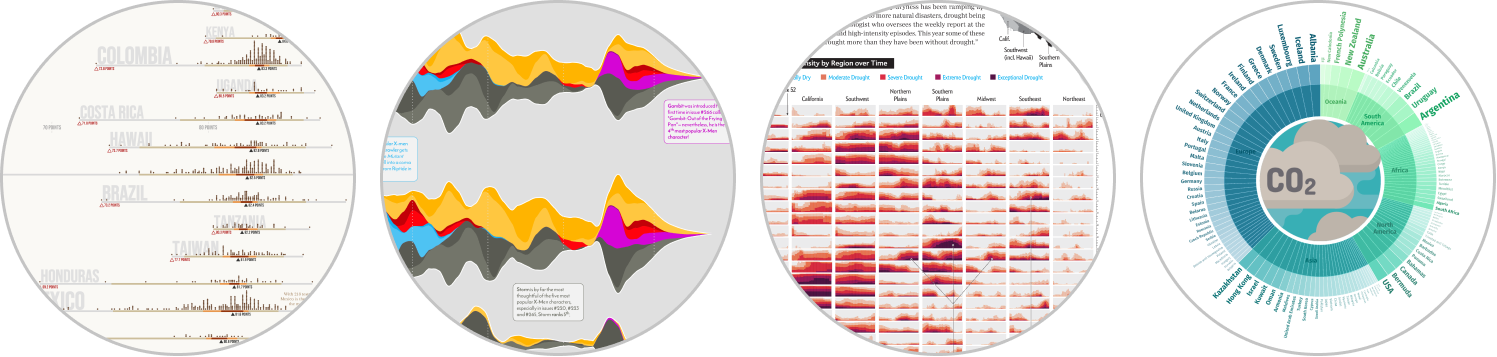
→ Data Visualization Gallery
→ Portfolio Slides
→ Curriculum Vitae
Data Visualization Design
I have been working as an independent data visualization specialist since the beginning of 2020. Since then I have worked for a large number of clients as a designer, consultant, analyst, and workshop instructor in the field of data visualization and information graphics as well as reproducible analysis and reporting.
I am constantly strengthening my skills in design and have built a diverse portfolio covering a wide range of topics, chart types, purposes, and tools by creating commisioned work, conducting self-led personal projects, and contributing to numerous data visualization challenges such as #TidyTuesday, #30DayMapChallenge, and #30DayChartChallenge.
Computational Ecology
Before becoming a independent contractor, I was working as a part-time scientific researcher (PostDoc) in the Department “Ecological Dynamics” at the Leibniz Institute for Zoo and Wildlife Research (IZW) in Berlin, Germany. As a computational scientist, I applied analytic and mechanistic modeling approaches to answer questions related to the movement ecology of animals and the dynamics of populations, communities and diseases in space and time. In 2019, I was awarded a Ph.D. degree in Ecology (Dr. rer. nat.) at the University of Potsdam as part of the BioMove research training group.

Code–First Approach
My favorite tool for all data-related tasks, no matter if for data visualization design, research, or analytics, is the R programing language. R is an open source and highly extensible language for statistical computing and graphics techniques. A code–first, script–based workflow allows for reproducible, transparent, and partly or completely automated workflows to generate visualizations and tables but also reports, slides, and more.
To visualize data I mainly utilize the {ggplot2} graphics library from the {tidyverse} package collection including many more that I use on a daily basis for all kinds of data preparation and analysis. More recently, I find myself enjoying using also other, no-coding design and charting tools such as Figma, DataWrapper, and Flourish which I combine with the code–first approach.
Contact
Dr. rer. nat. Cédric Scherer
Independent Data Visualization Specialist
hello@cedricscherer.com
Selected Presentations
- “(Even more) exciting data visualizations with ggplot2 extensions”
Berlin useR Group and R Ladies Rome – 10+11|2023 – Berlin, Germany, and remote
> Slides > Recording - “Engaging visualization design to successfully communicate data.”
MALT Community, Forum Ökologisch-Soziale Marktwirtschaft e.V. (economic think tank), Marie Curie Alumni Association (MCAA), and more – 2022/2023 – remote - “Mit Grafiken Mehrwert schaffen: Prinzipien effektiver Datenvisualisierung und -kommunikation.”
Federal Institute for Population Research (Bundesinstitut für Bevölkerungsforschung) – 02|2022 – remote
> Slides (German) > Slides (English) - “Beyond bar and box plots: chart alternatives and how to design them with ggplot2”
USGS Community for Data Integration – 09|2021 – remote
> Slides > Recording > Hands-On Tutorial - “My favorite ggplot2 extension packages.”
R Ladies Tunis – 07|2021 – remote
> Slides > Recording - “The first #30DayChartChallenge: A summary of inspiring contributions, our learnings, and about the value of challenges in general.”
DataVis Lisboa – 05|2021 – remote
> Slides > Recording - “ggplot wizardry: my favorite tricks and secrets for beautiful plots in R.”
Talks + Coding Session – DVS Outlier Conference 2021 – 02|2021 – remote
> Slides > Recording > Hands-On Tutorial - “Effective data visualization: how to design impactful and aesthetically pleasing charts.”
Heureka Labs & Duke+DataScience – 10|2020 – Duke University, Durham, USA (Webinar)
> Slides > Recording
Schedule a discovery call!
Selected Trainings
- “Communicating insights with engaging data visualizations and dashboards”
2-Day Workshop – Supercell – 02|2024 – Helsinki, Finland - “Data visualization in science: how to create beautiful charts with
ggplot2”
2x 1/2-Day Workshop – University of Uppsala – 11|2021, 12|2022 + 11|2023 – remote - “Designing charts in R: reproducible chart design with {ggplot2}”
4-Hour Workshop – DVS Masterclass presented by Data Visualization Society – 03|2023 – Berlin/remote
> Slides > Course Materials - “Color palette choice and customization in R and {ggplot2}”
2-Hour Workshop – Workshops for Ukraine – 01|2023 – remote
> Slides > Course Materials - “Graphic design with {ggplot2}: how to create engaging and complex visualizations in R”
2-Day Conference Workshop – rstudio::conf(2022) by Posit – 07|2022 – Washington, D.C., USA
> Course Webpage - “Mastering scientific data visualizations: principles and practice with {ggplot2}”
2x 1/2-Day Conference Workshops – European Meeting for PhD Students in Evolutionary Biology (EMPSEB) – 05|2022 – Espoo, Finland - “Hands-on data visualization with ggplot2: how to create engaging and well-designed visualizations in R”
5-hour Live Training – Pearson–O'Reilly Live Training Event – 09|2021, 12|2021 + 04|2022 – remote - “Effective data visualization: convert information into visual forms—and tell a story”
1/2-Day Workshop – Senckenberg Young Scientists – 11|2021 – remote - “Data visualization in R (Beginner + Advanced)”
Two 2-Day Workshops for Royal Zoological Society of Belgium (RZSB) and Statistics Communication Section of the Netherlands Society for Statistics and Operations Research – remote – 10|2021 + 12|2021 - “Data visualisation techniques for data scientists”
2-Day Internal Training – Marine Stewardship Council (MSC) – 02|2021 – remote
Schedule a discovery call!
Selected Publications
- (2022) Modelling the power of acoustic monitoring to predict bat fatalities at wind turbines.
Conservation Science and Practice 4:e12841 - (2022) A simple kit to use computational notebooks for more openness, reproducibility, and productivity in research.
PLOS Computational Biology 18(9):e1010356 - (2020) Moving infections: Individual movement decisions drive disease persistence in spatially structured landscapes.
Oikos 129(5):651–667 - (2019) Seasonal host life-history processes fuel disease dynamics at different spatial scales.
Journal of Animal Ecology 88(11):1639–1824 - The dimensionality of stability depends on disturbance type.
Ecology Letters 22(4):647–684 -
NLMRandlandscapetools: An integrated environment for simulating and modifying neutral landscape models in R.
Methods in Ecology and Evolution 9(11):2240–2248