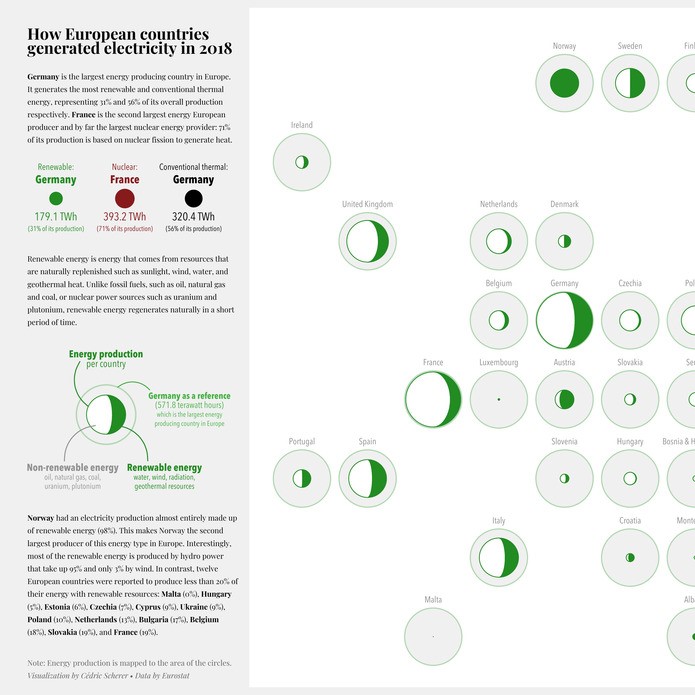
Collection of data visualizations, maps and other designs I have produced for clients, as challenge contributions or in my spare time. Most visualizations are generated with a code-first approach and many of them do not involve any manual post-processing steps.
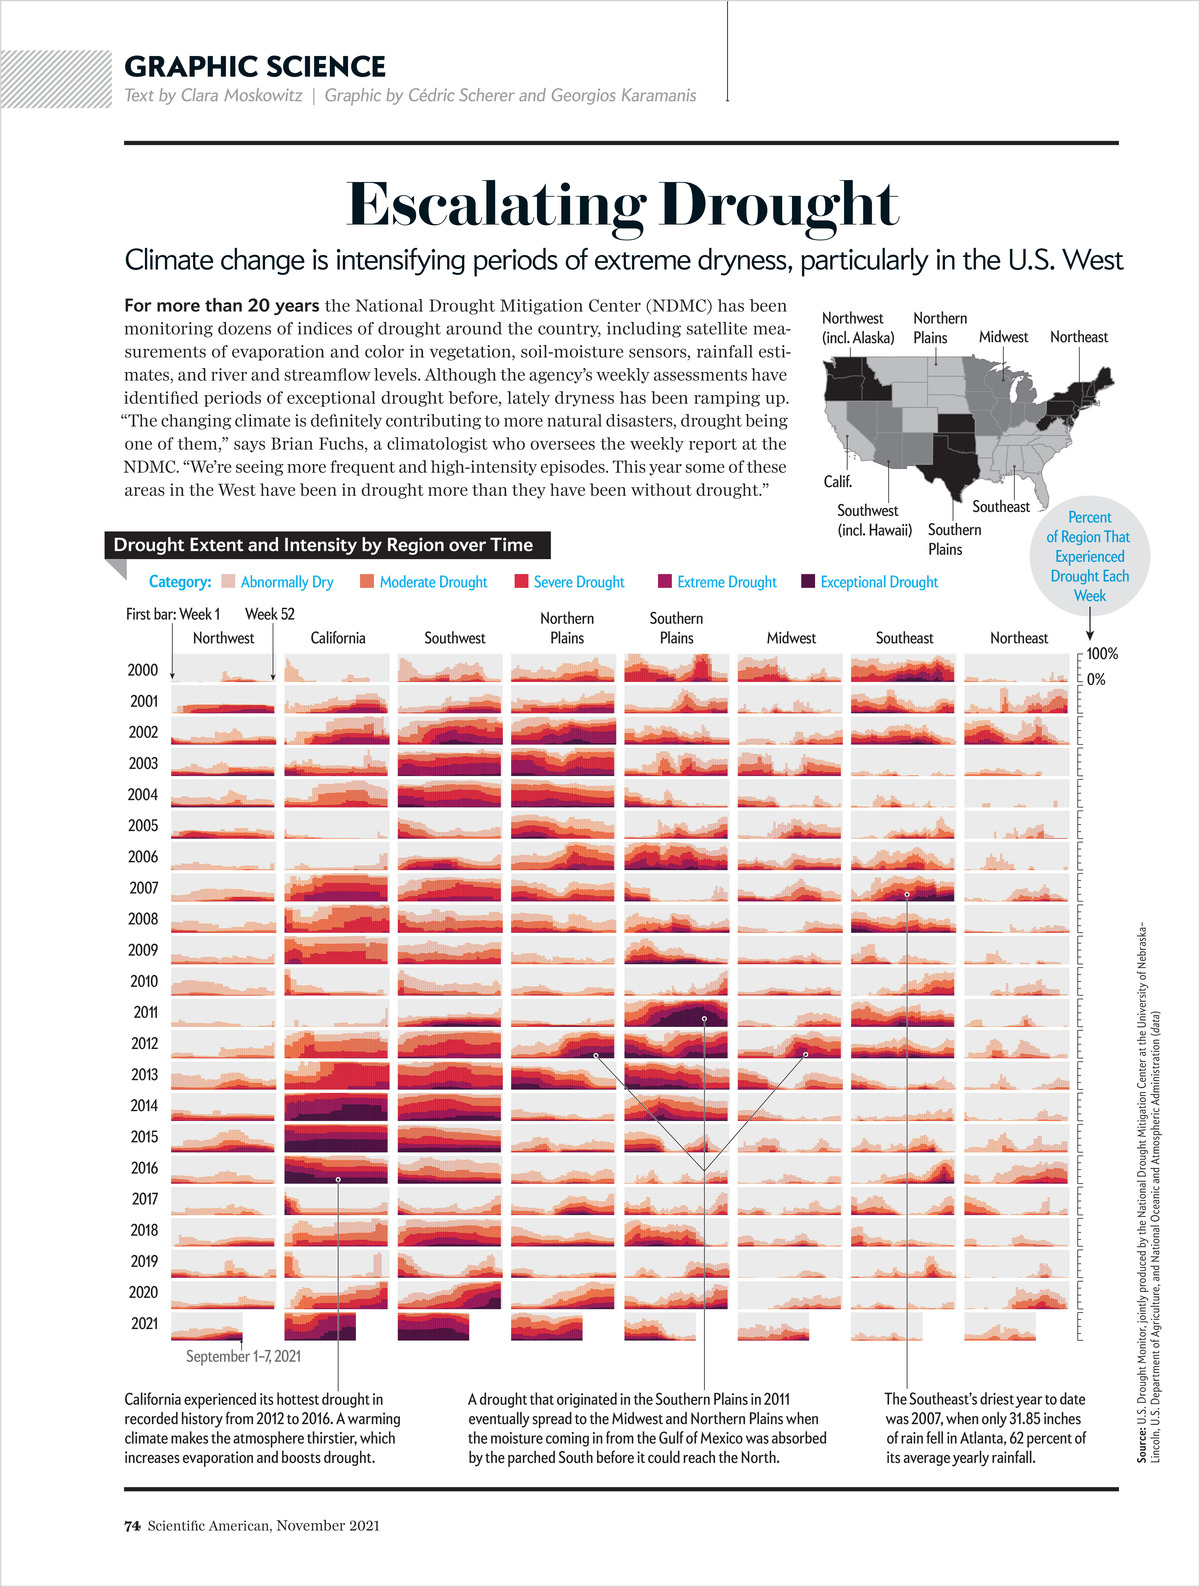
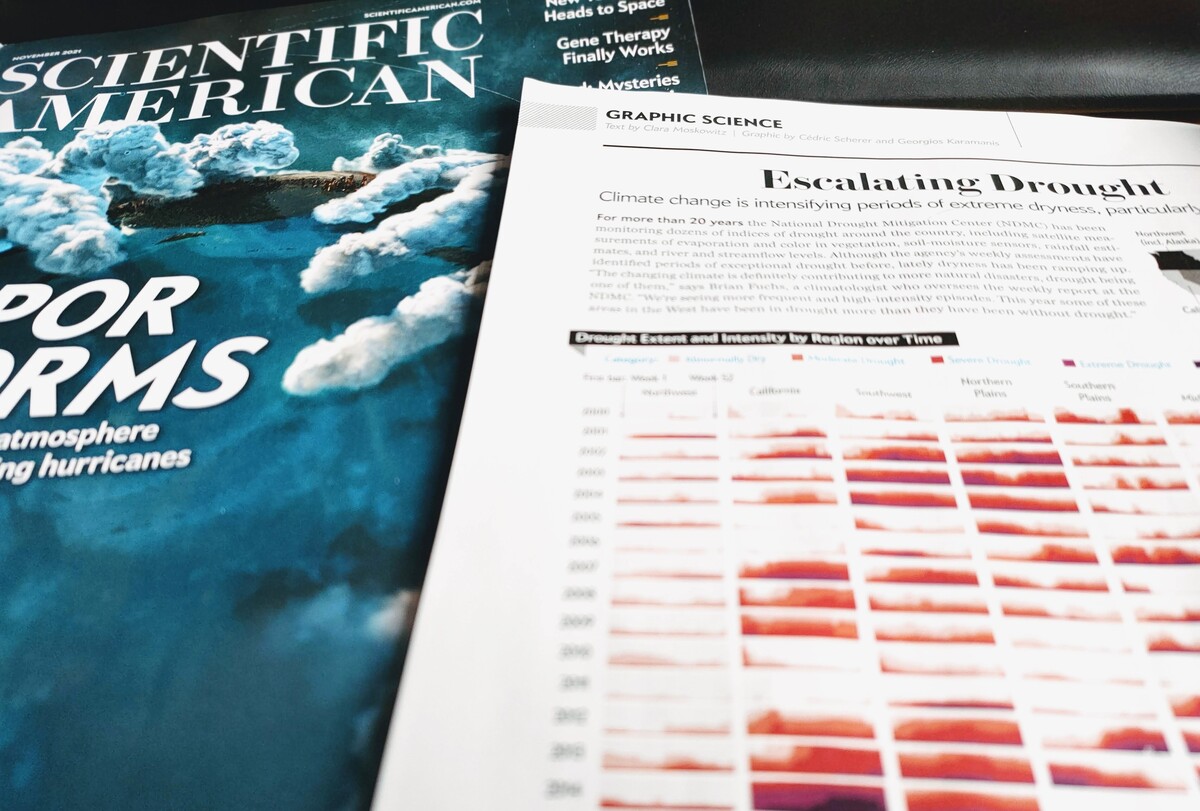
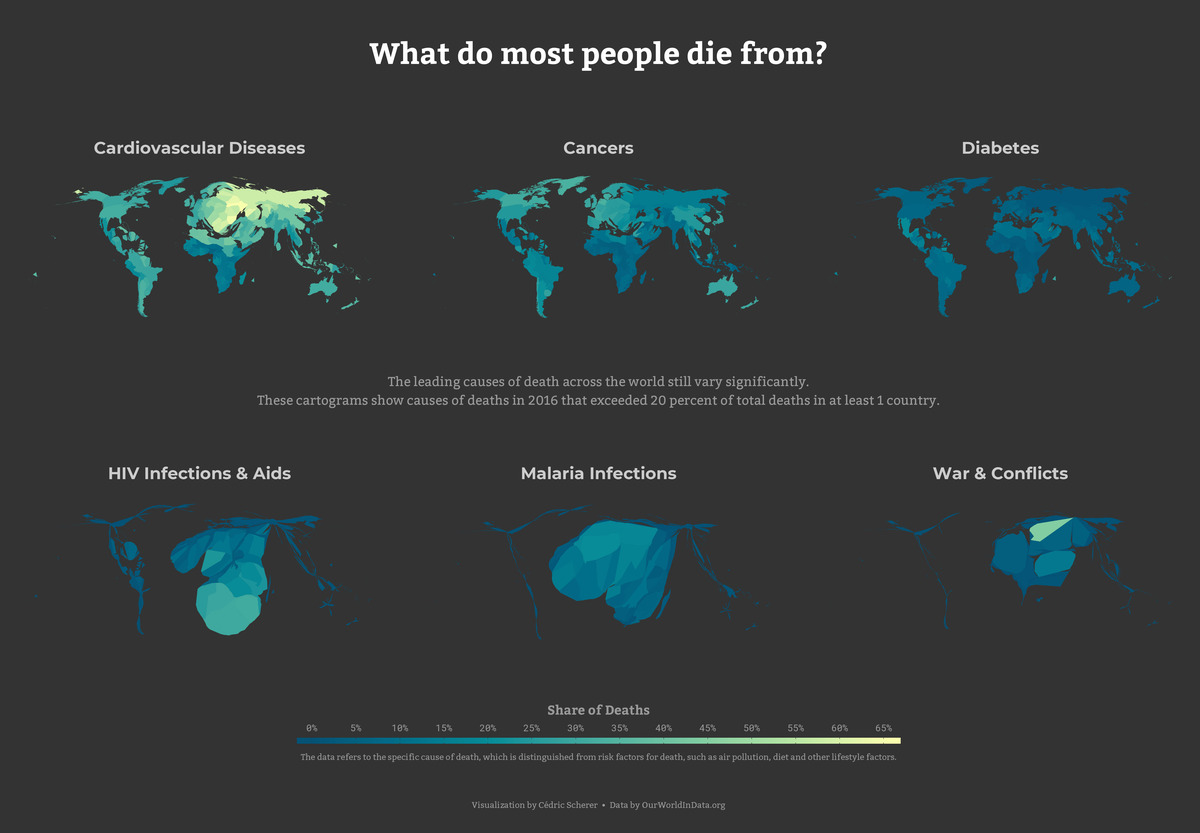
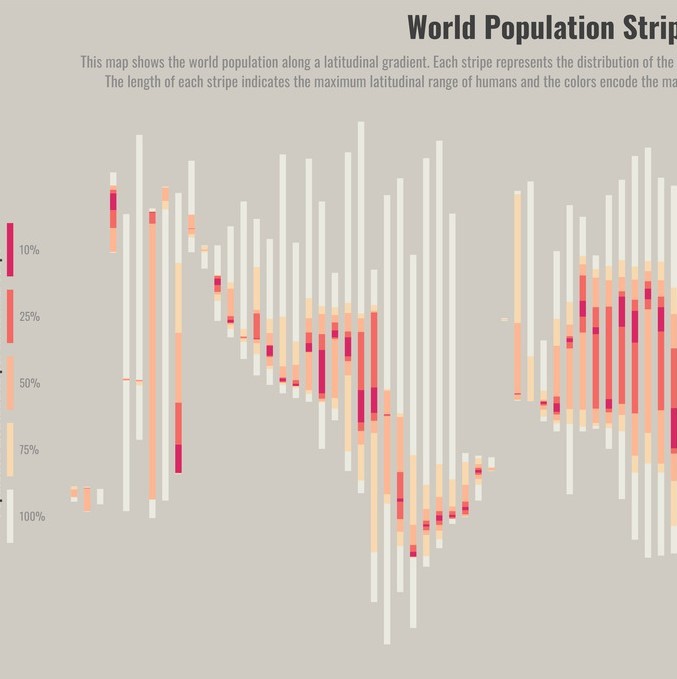
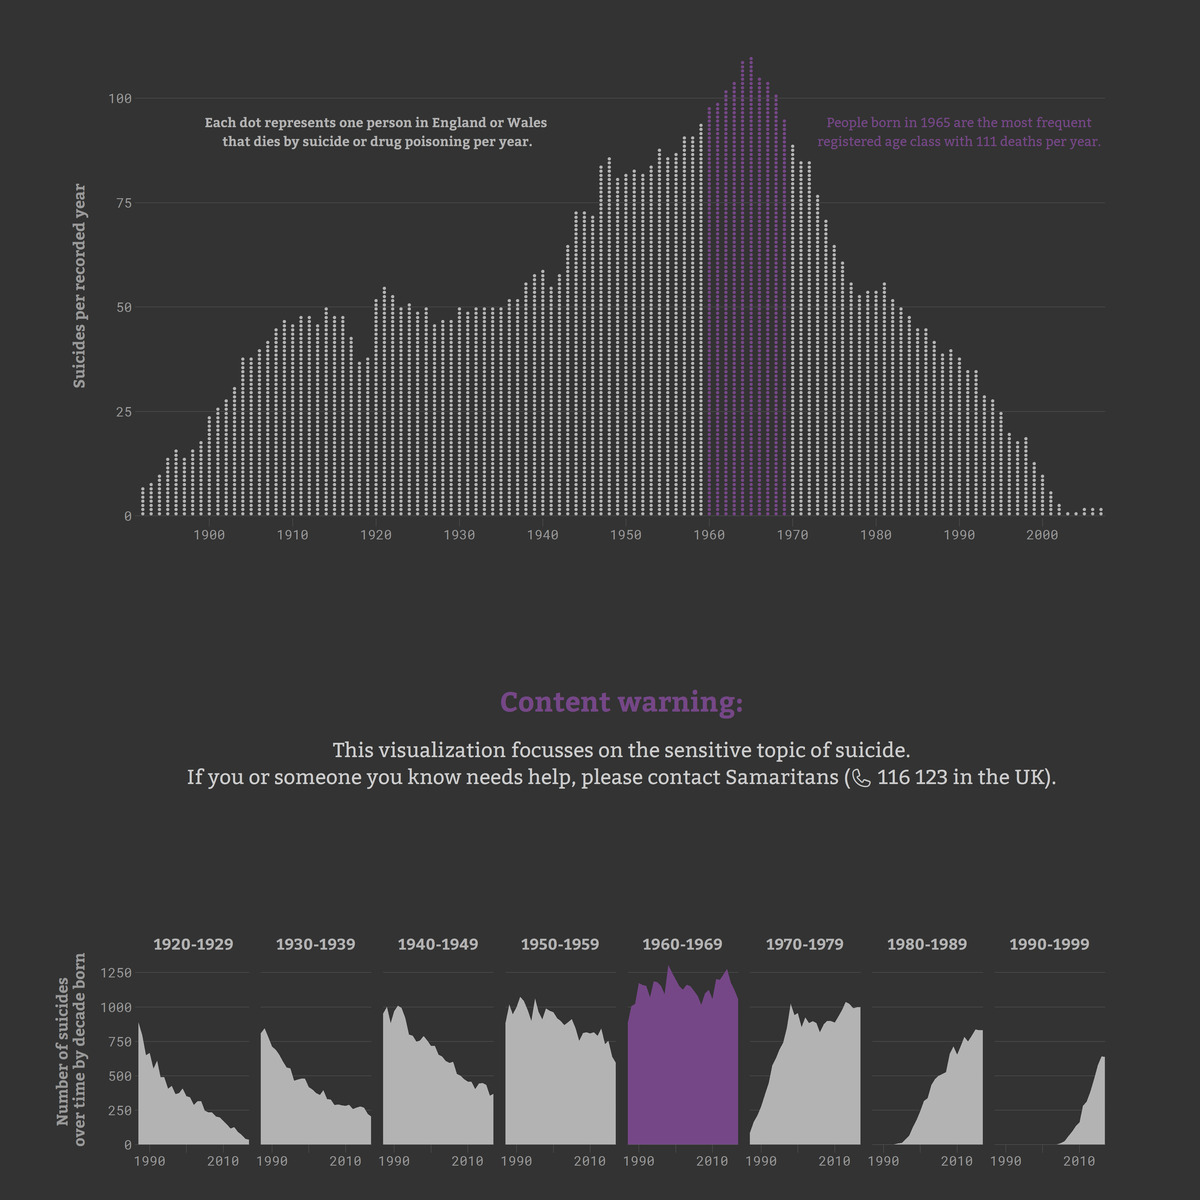
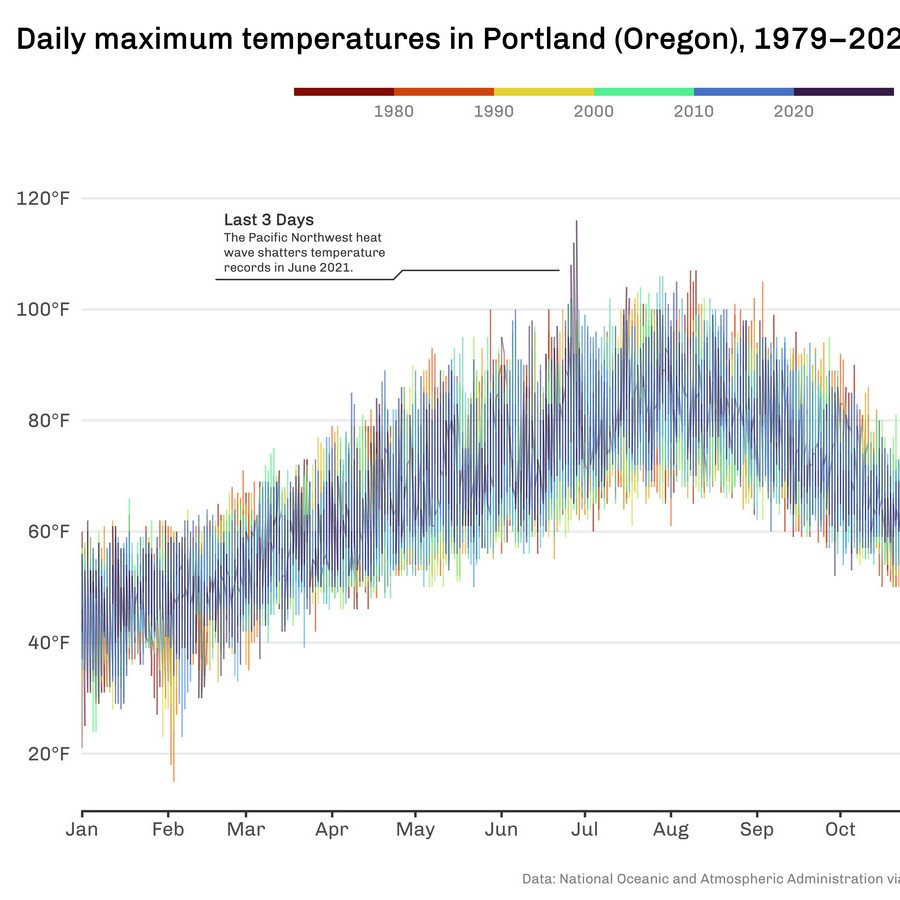
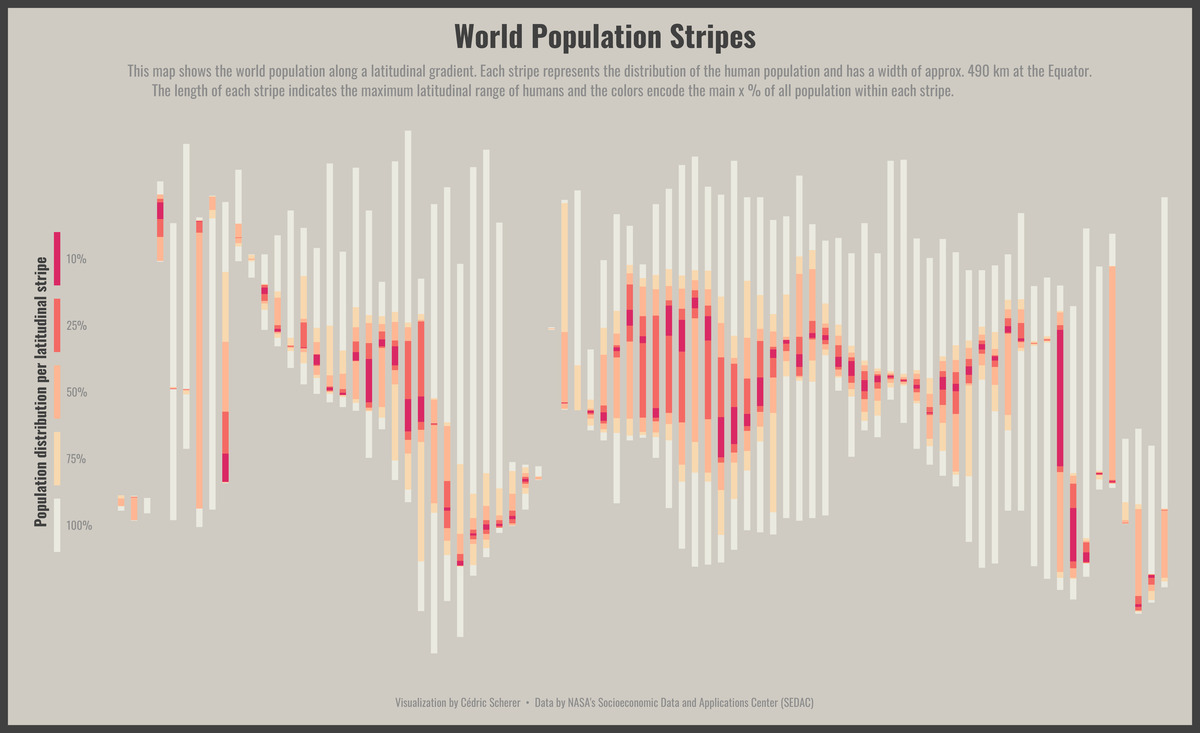
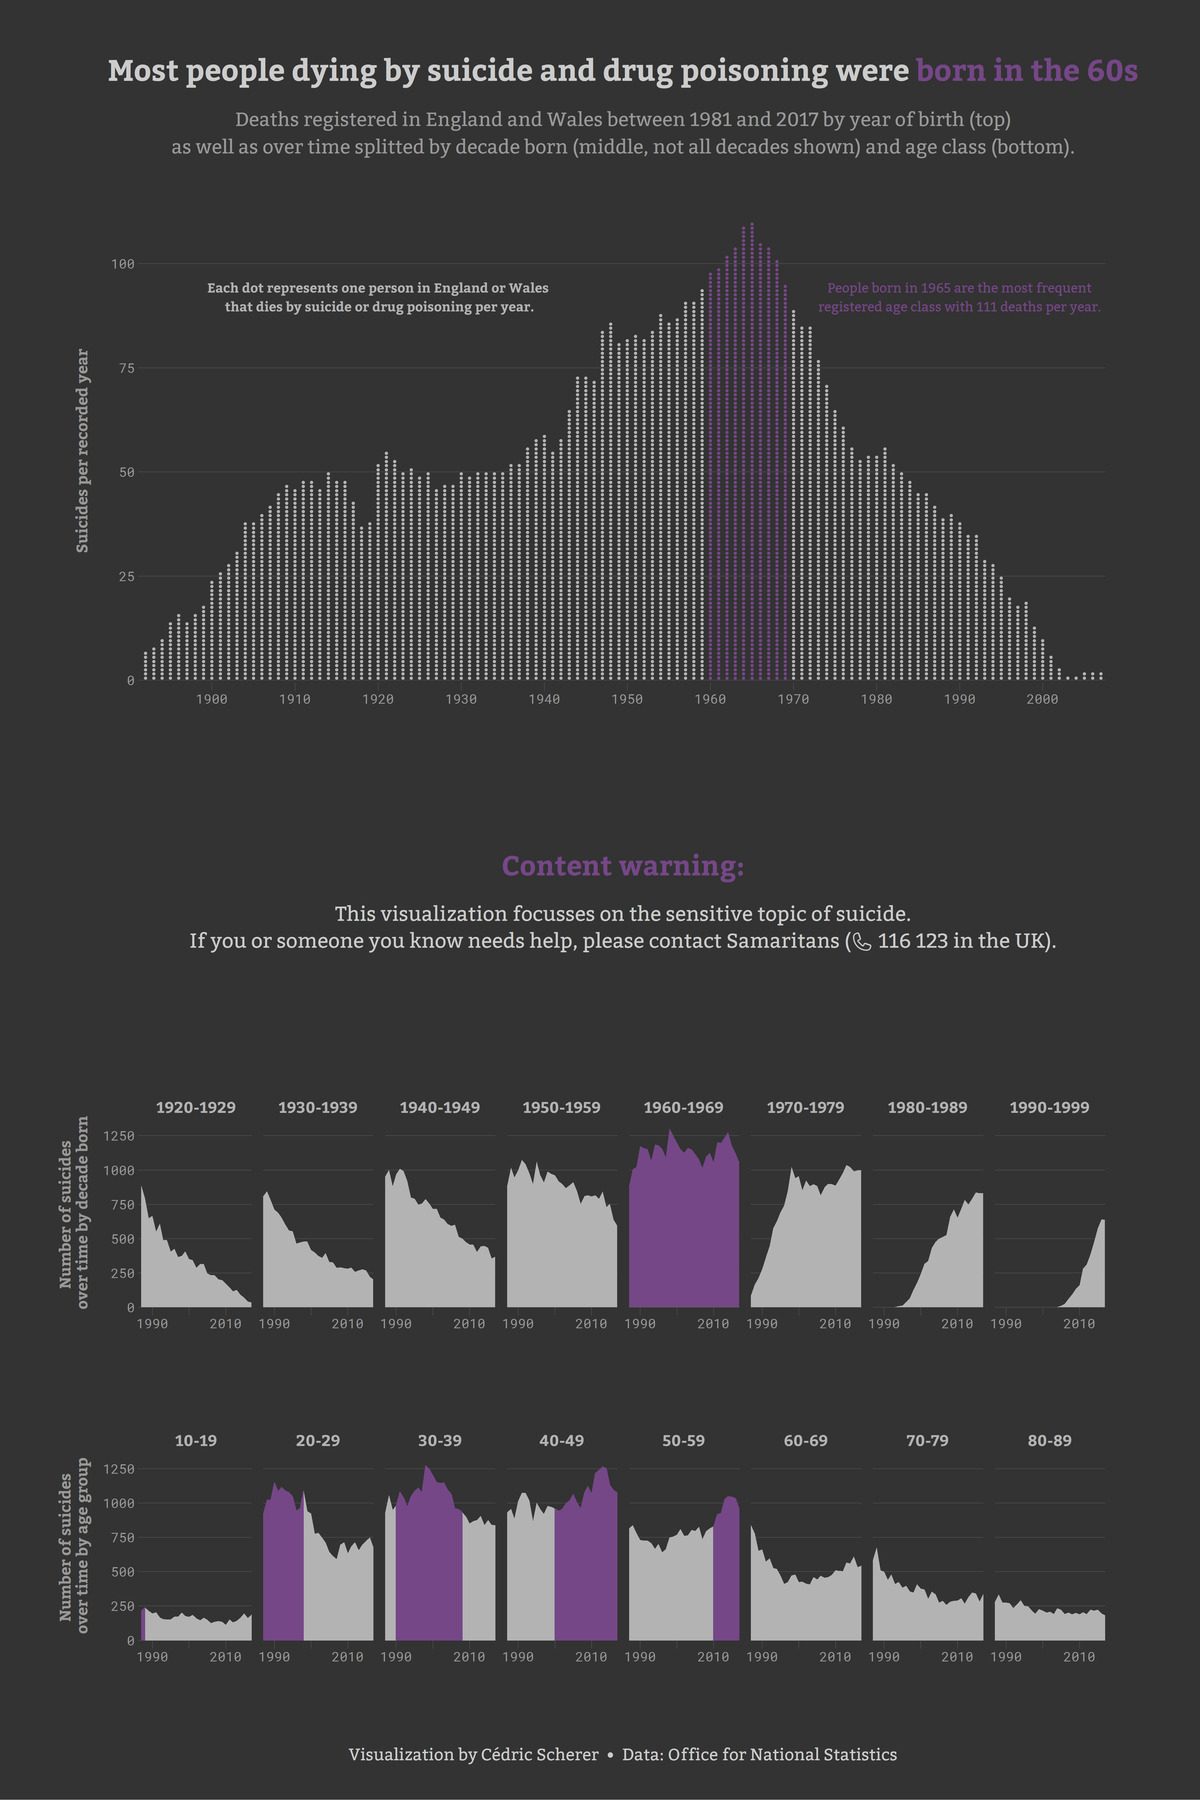
A one-page data visualization for the “Graphic Science” section of the popular science magazine “Scientific American” featured in the Nov 2021 issue in print and digital. Created together with Georgios Karamanis with editorial support by Jen Christiansen and Clara Moskowitz.
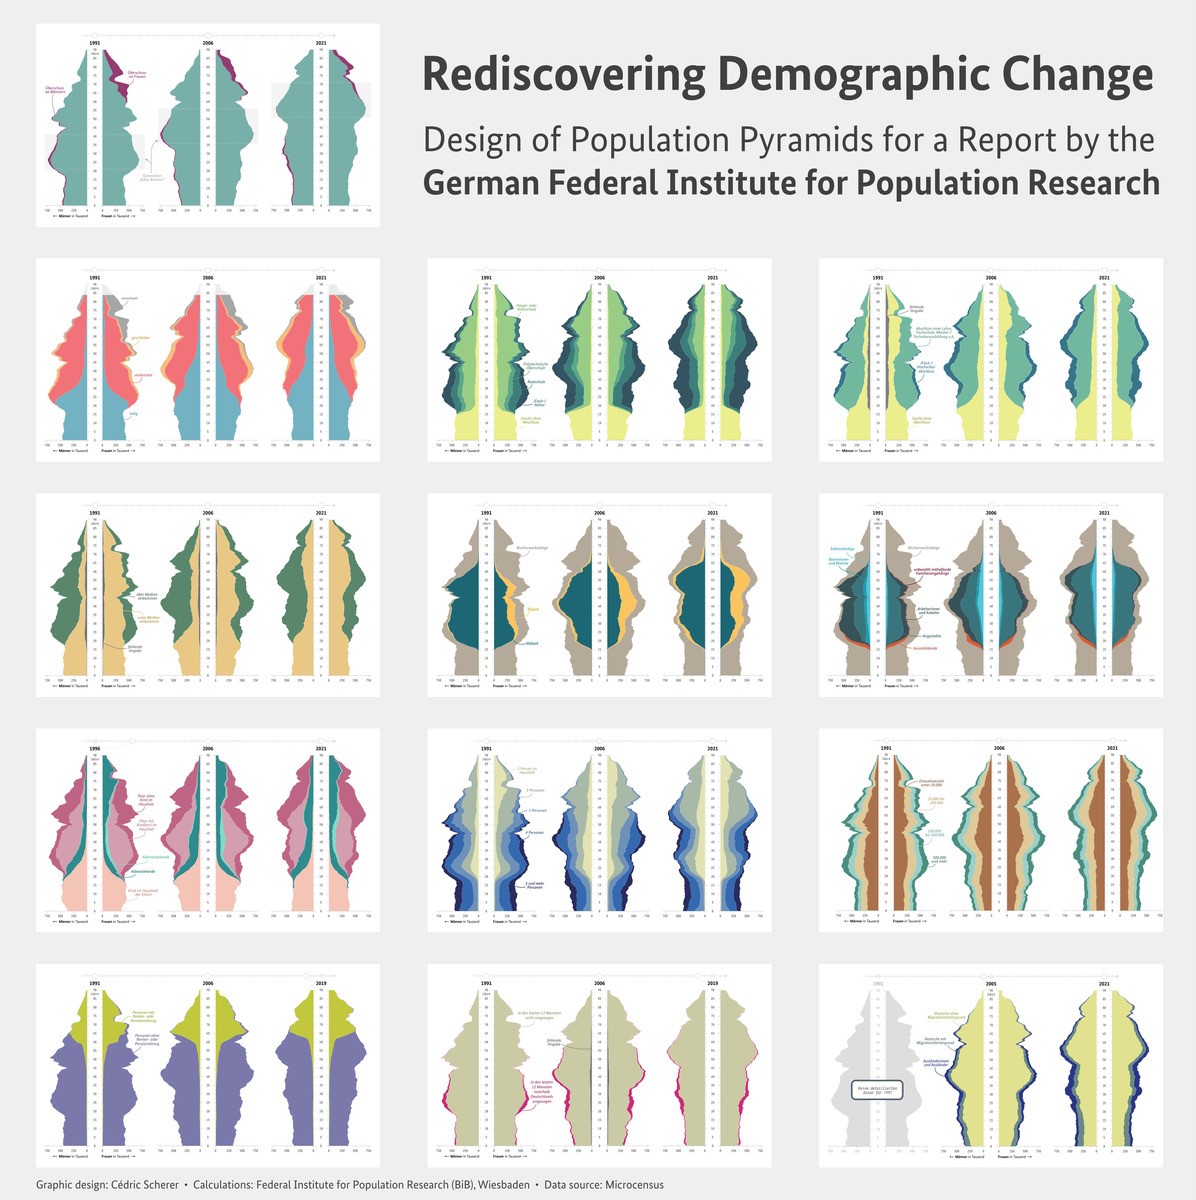
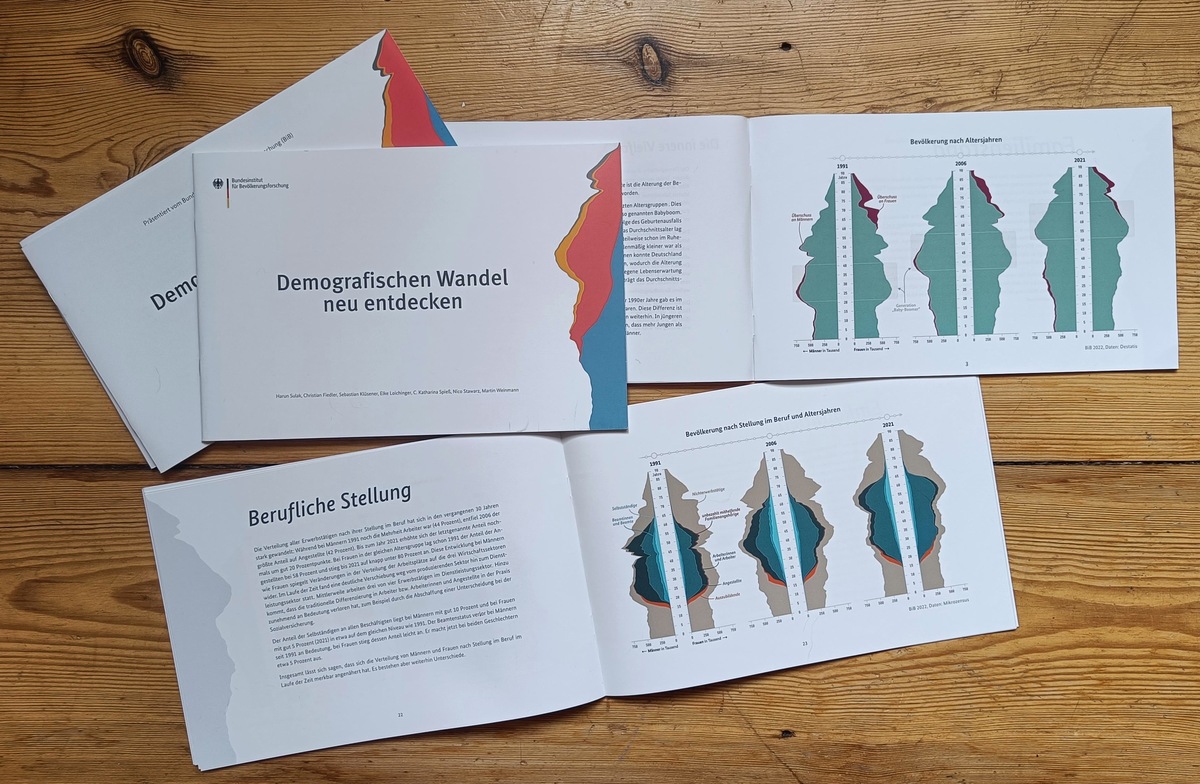
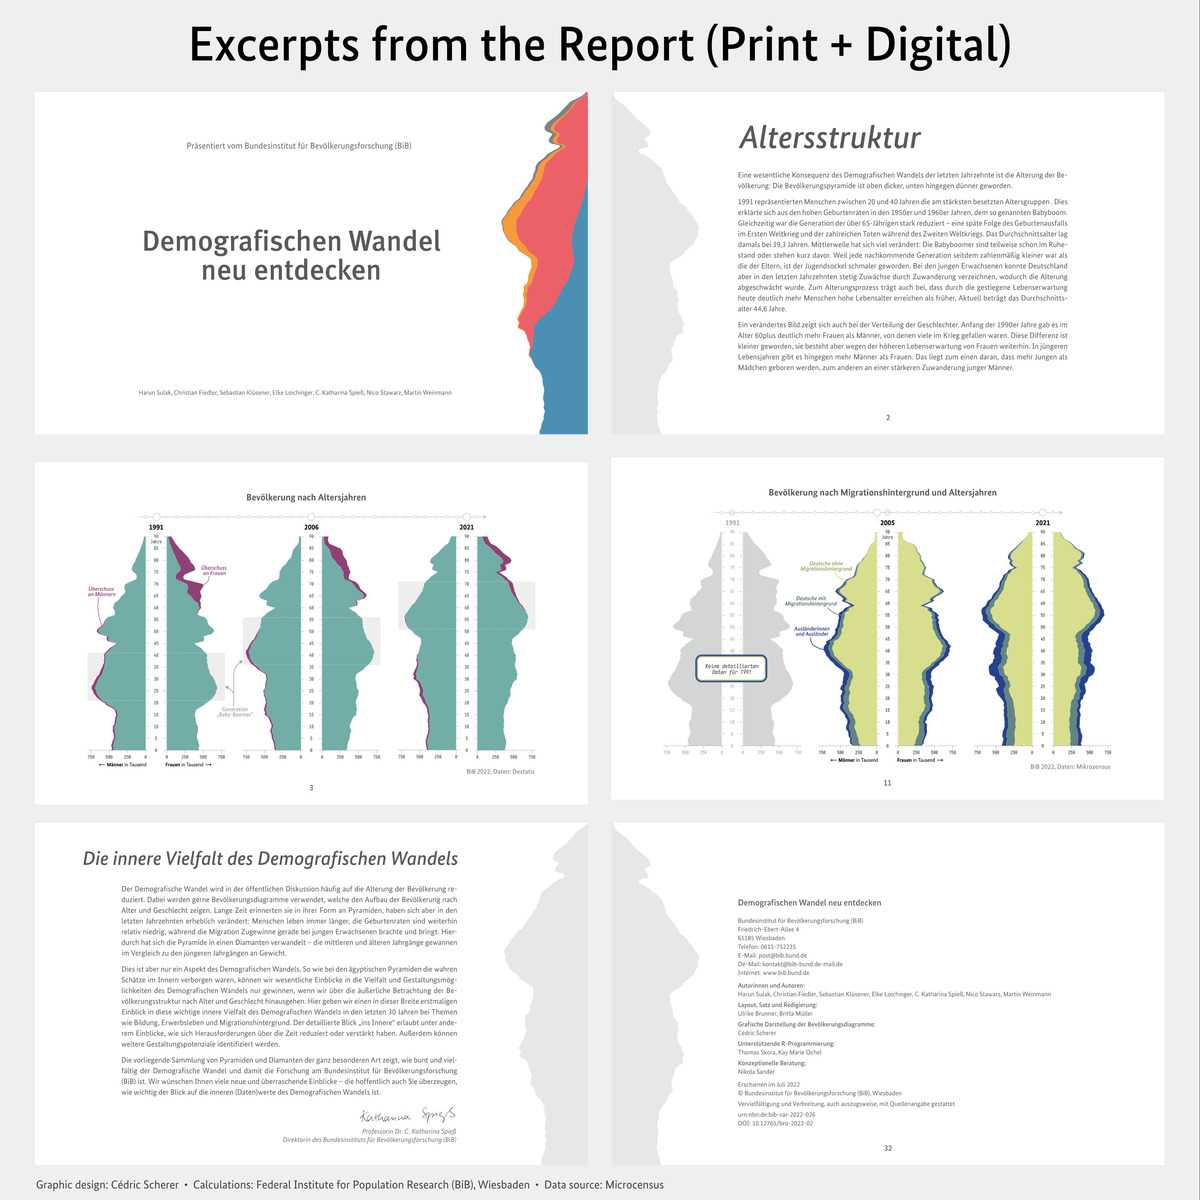
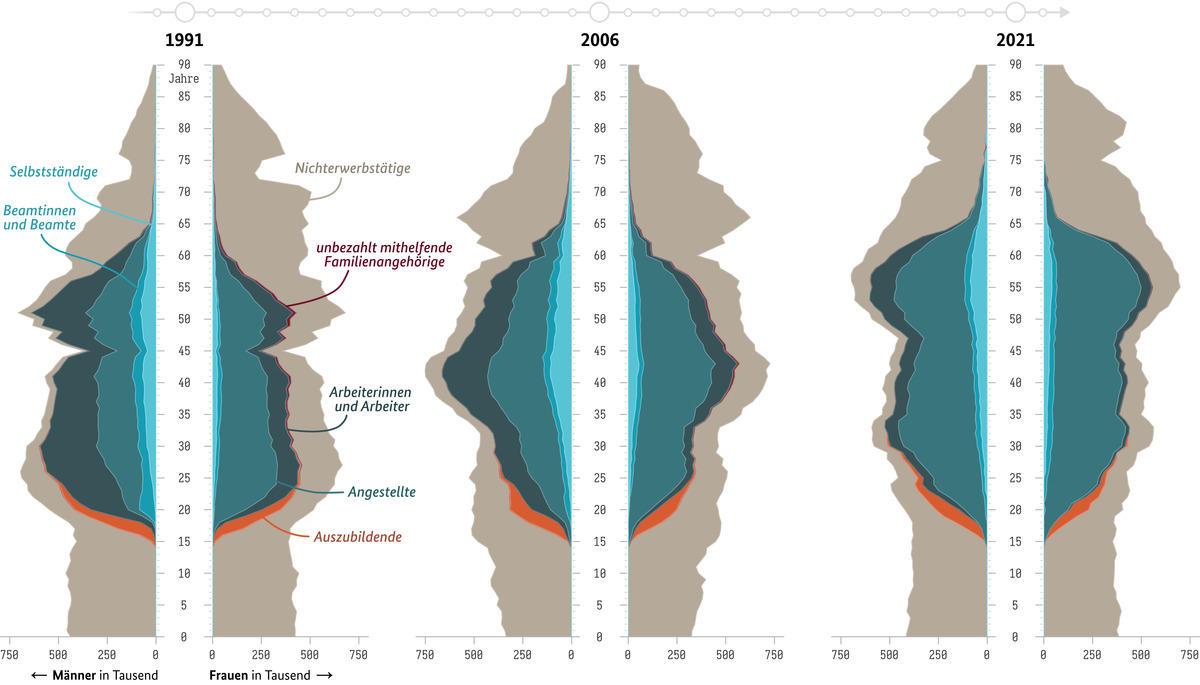
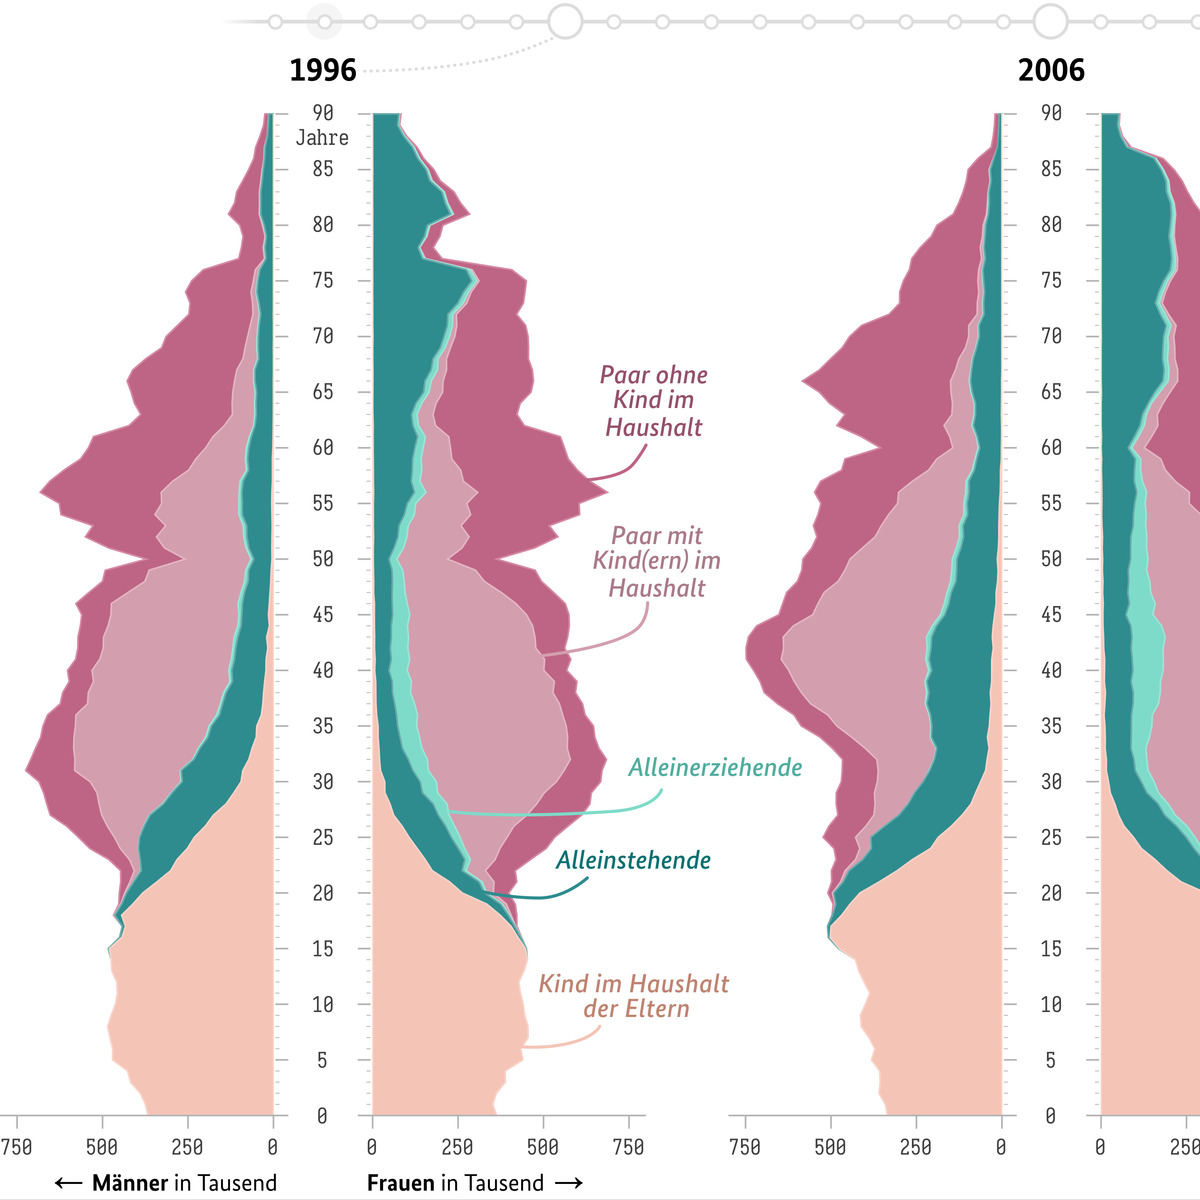
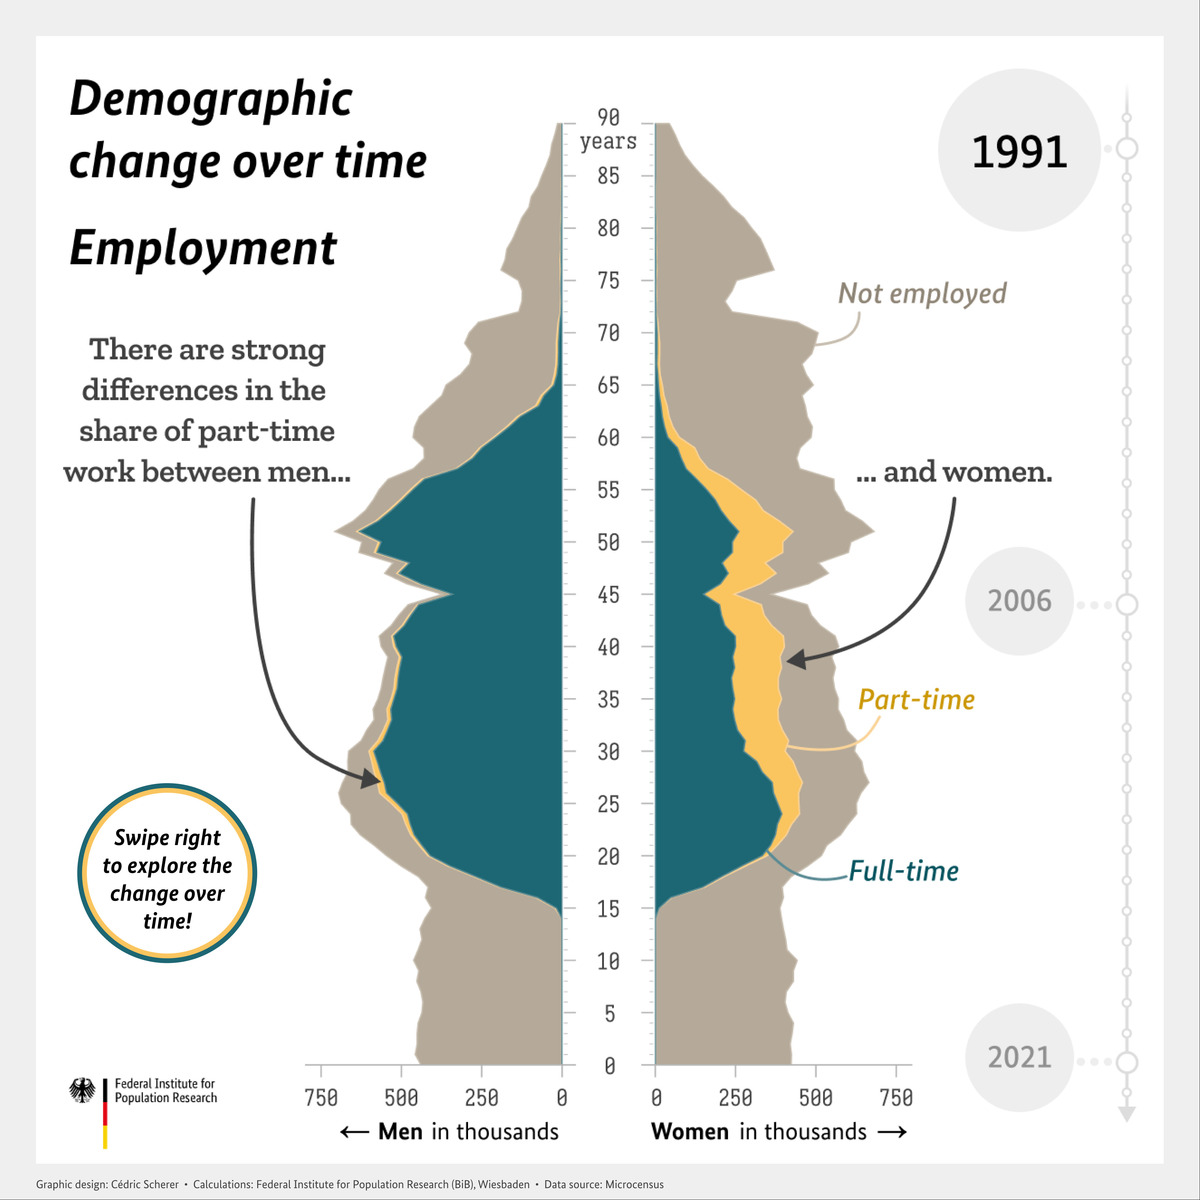
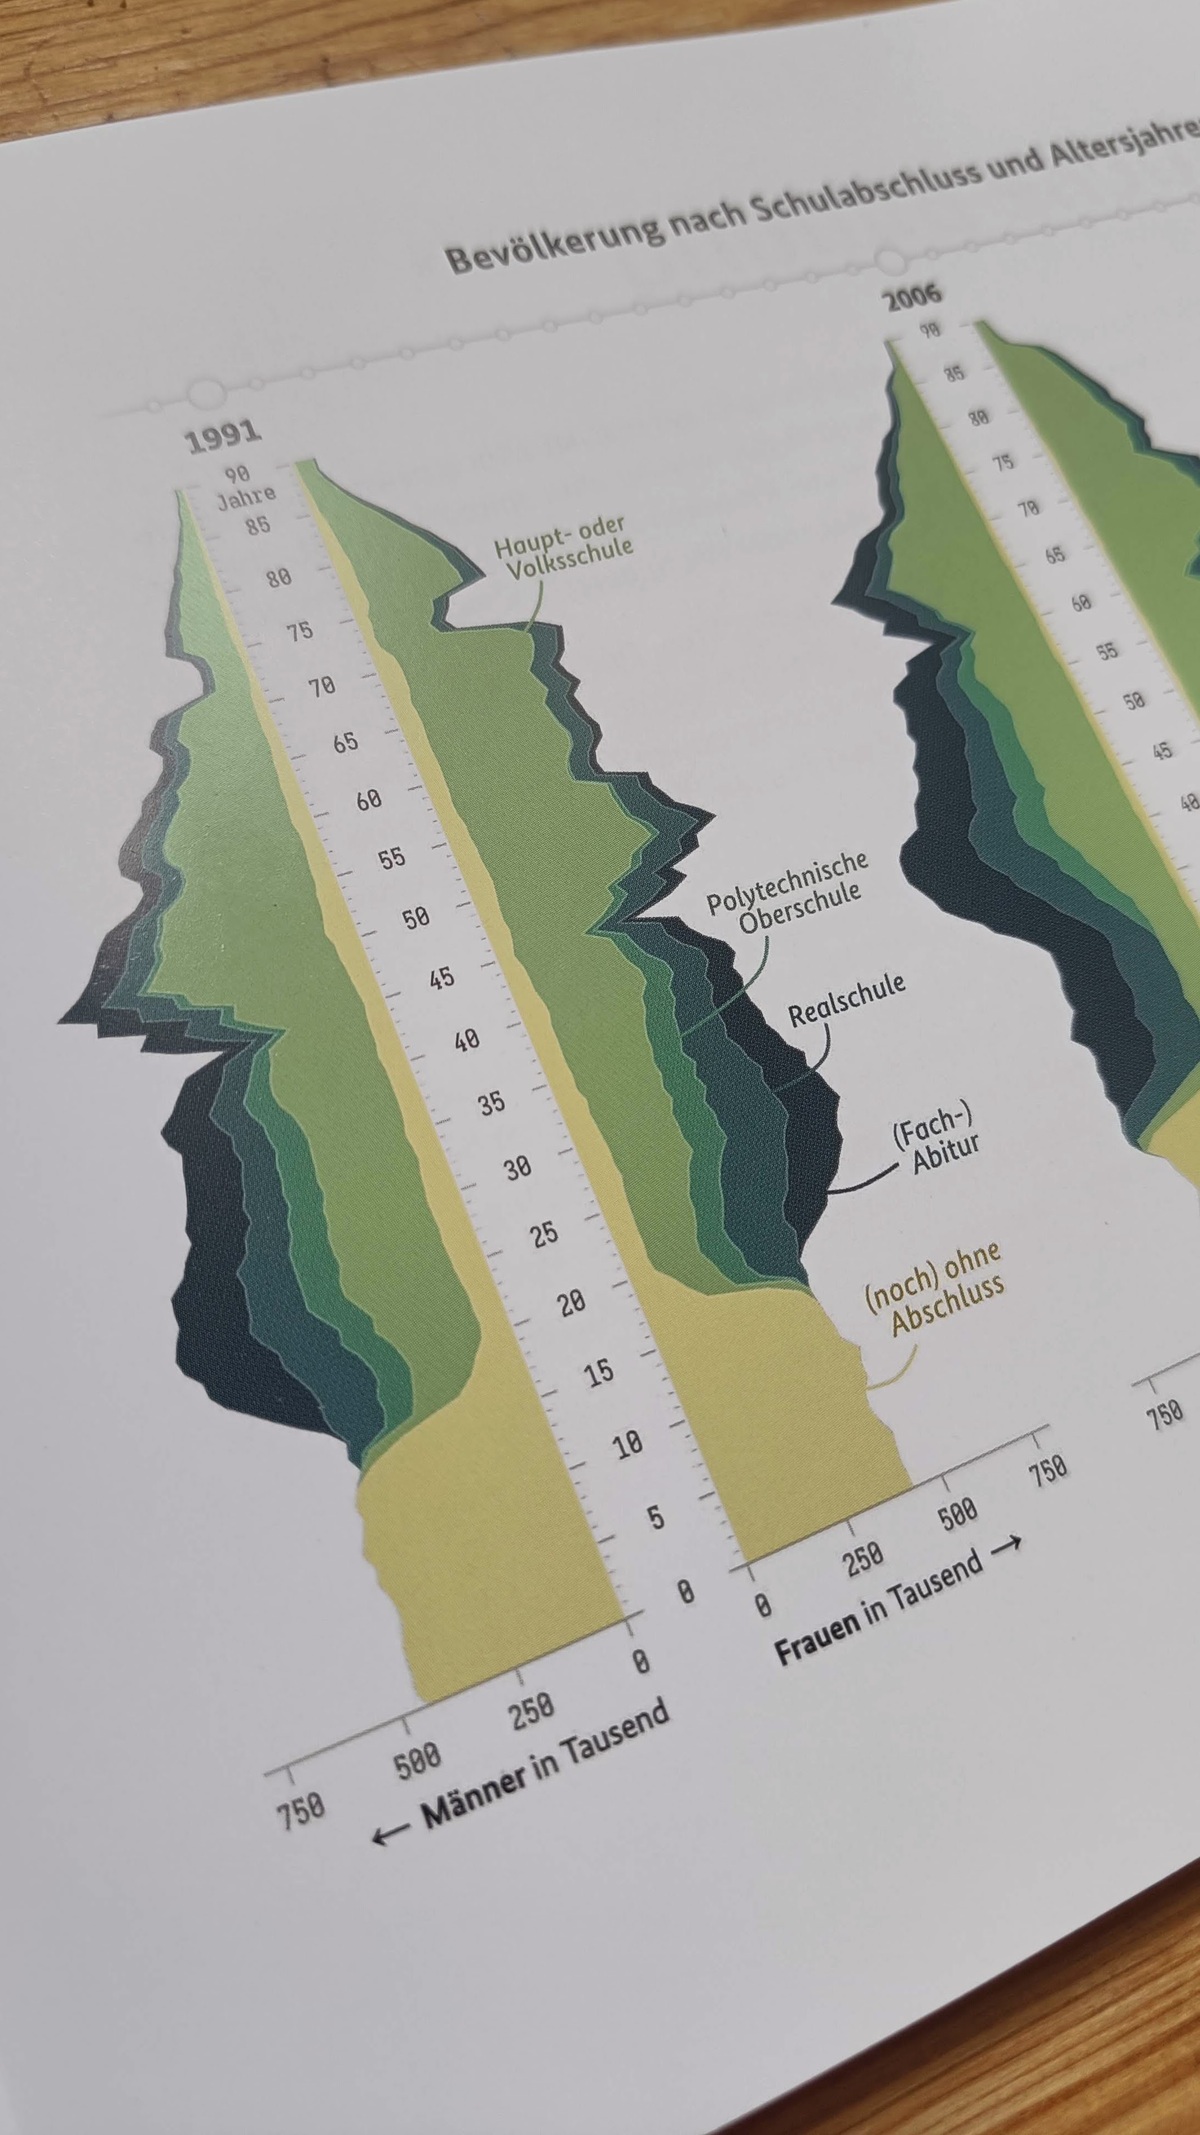
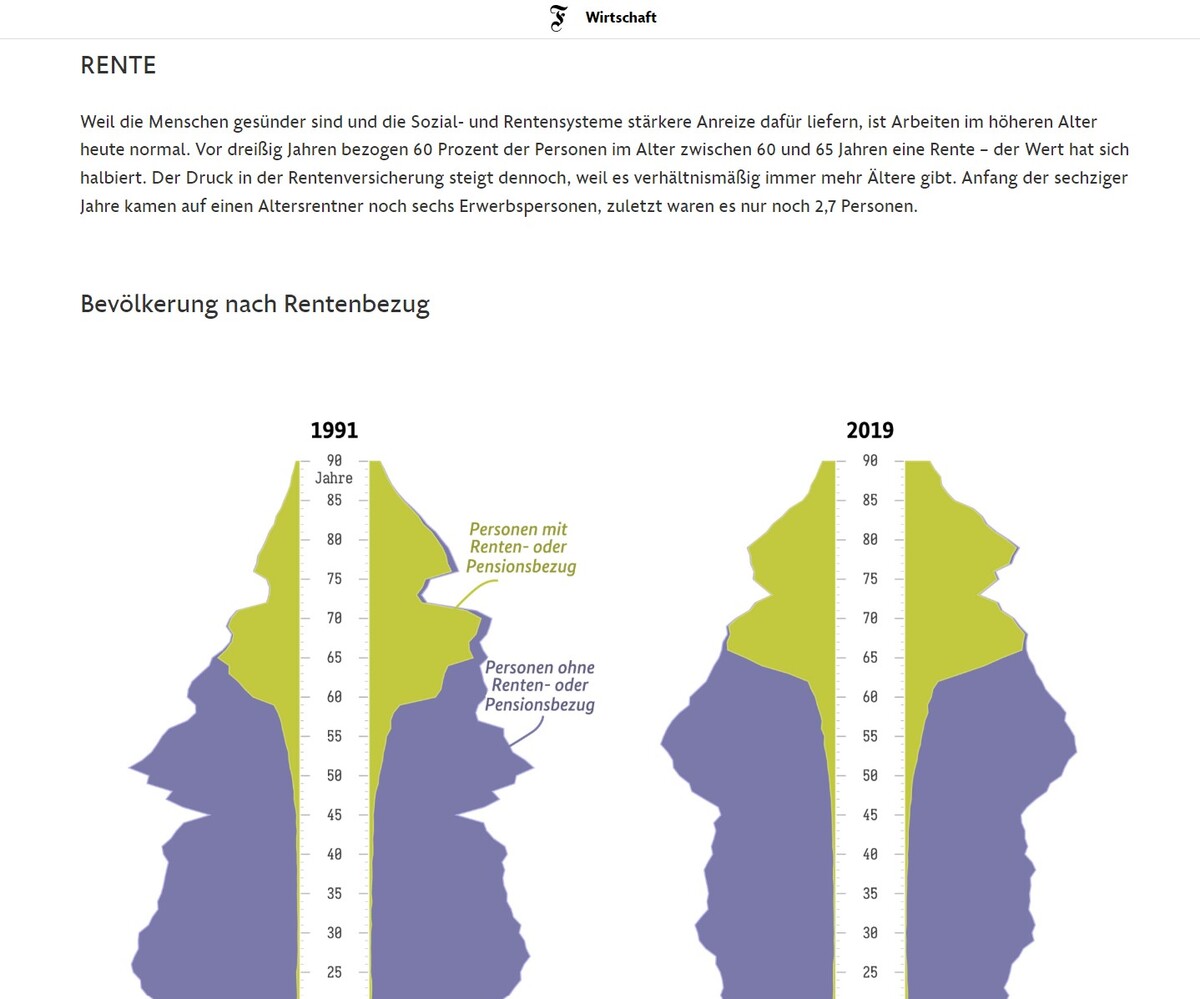
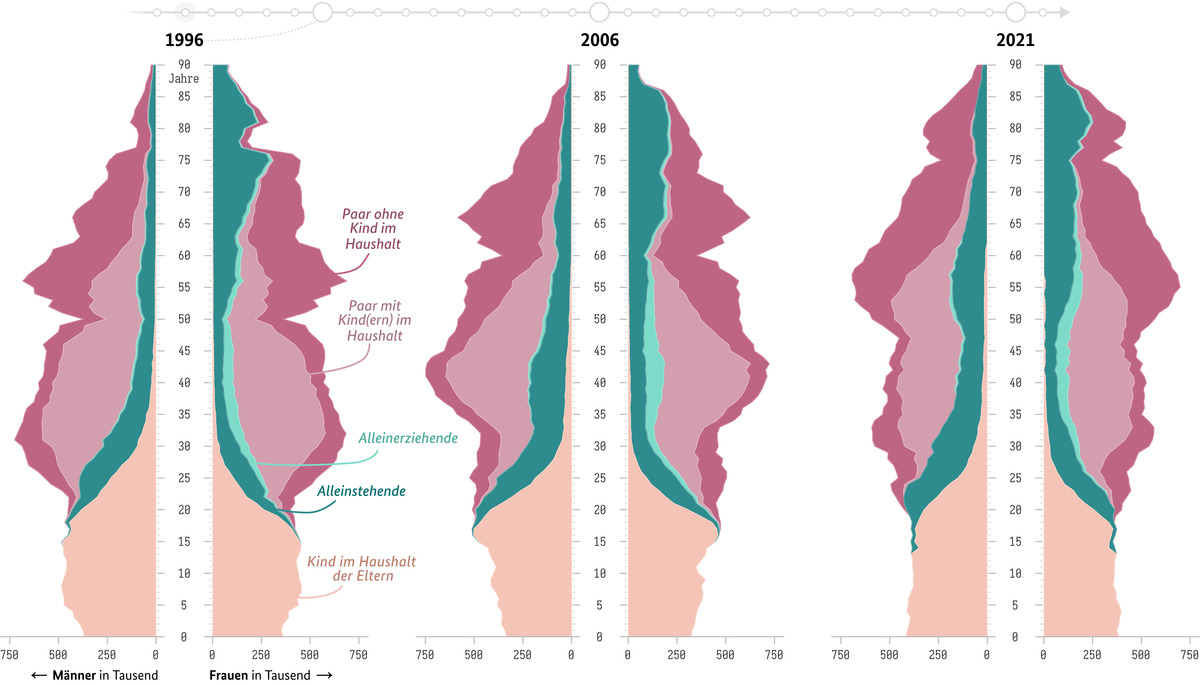
13 sets of population pyramids for the report “Rediscovering demographic change” by the Bundesinstitut für Bevölkerungsforschung (German Federal Institute for Population Research),
illustrating the demographic change in Germany over 30 years from various perspectives.
1 BiB population pyramids excerpts from the report
2 BiB population pyramids topic profession
3 BiB population pyramids topic living type
4 BiB population pyramids redesign for Instagram
5 BiB population pyramids details printed report
6 BiB population pyramids featured in the German newspaper Frankfurter Allgemeine Zeitung
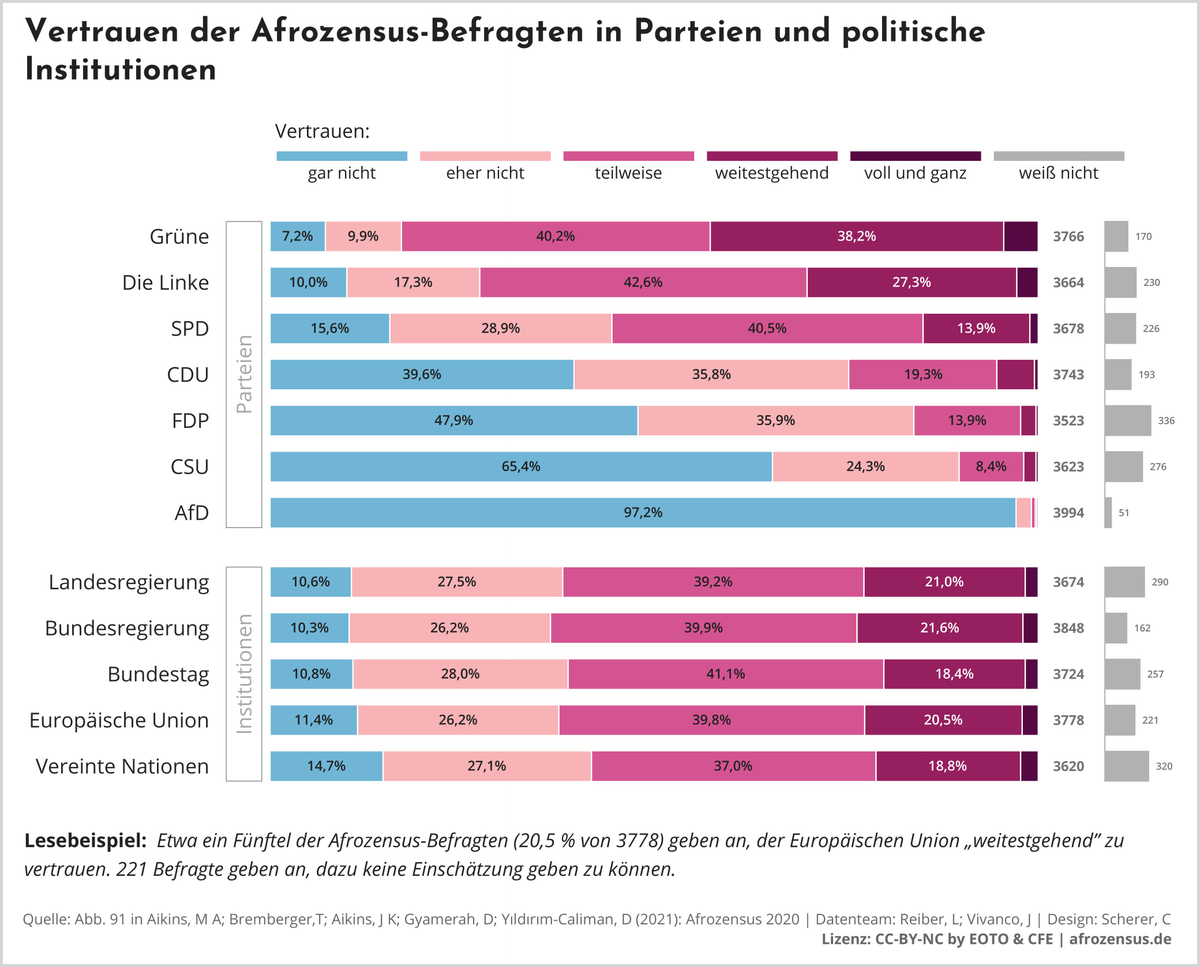
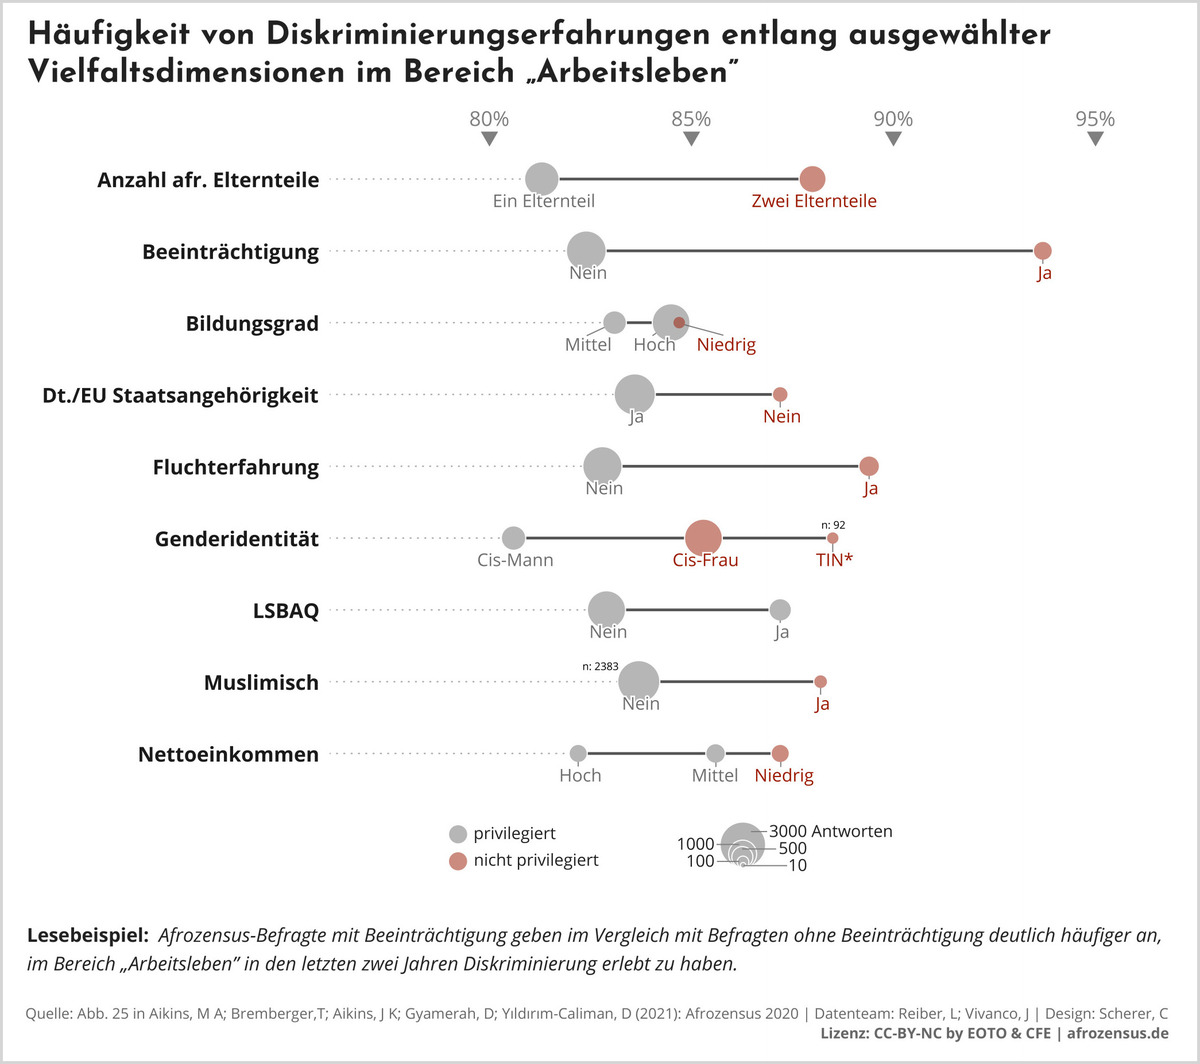
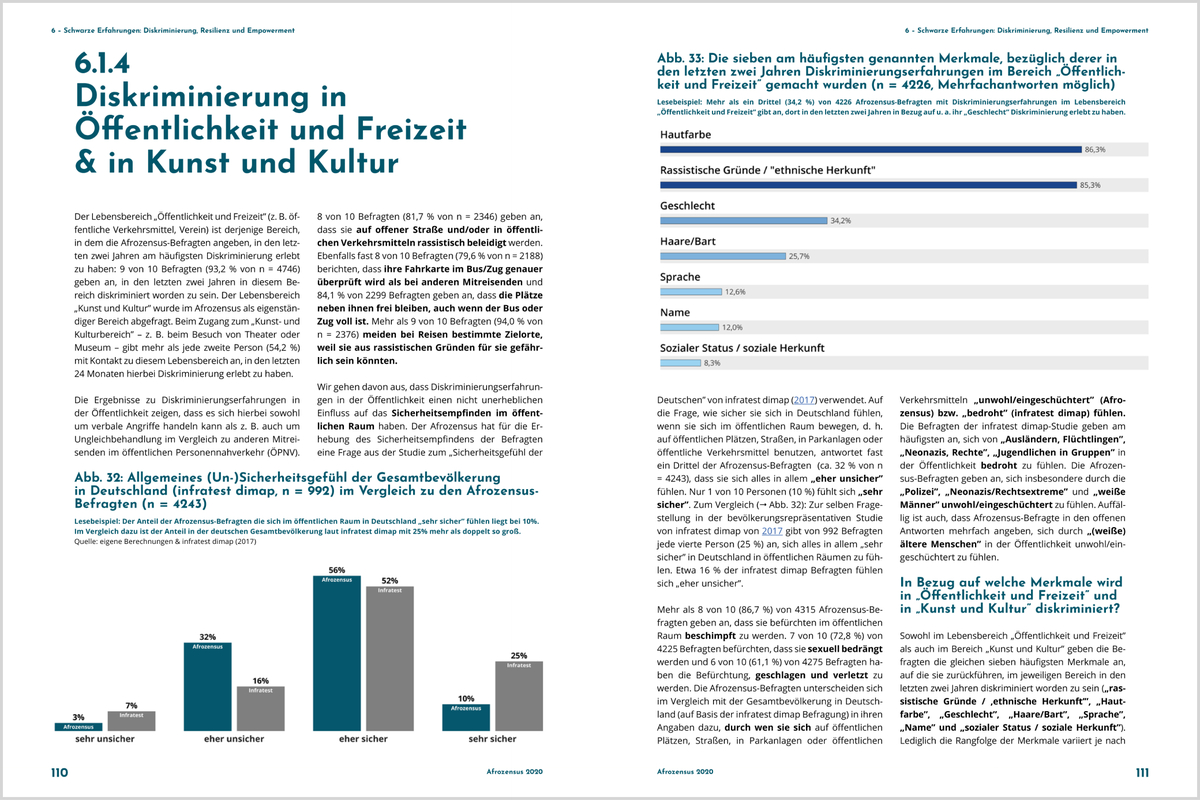
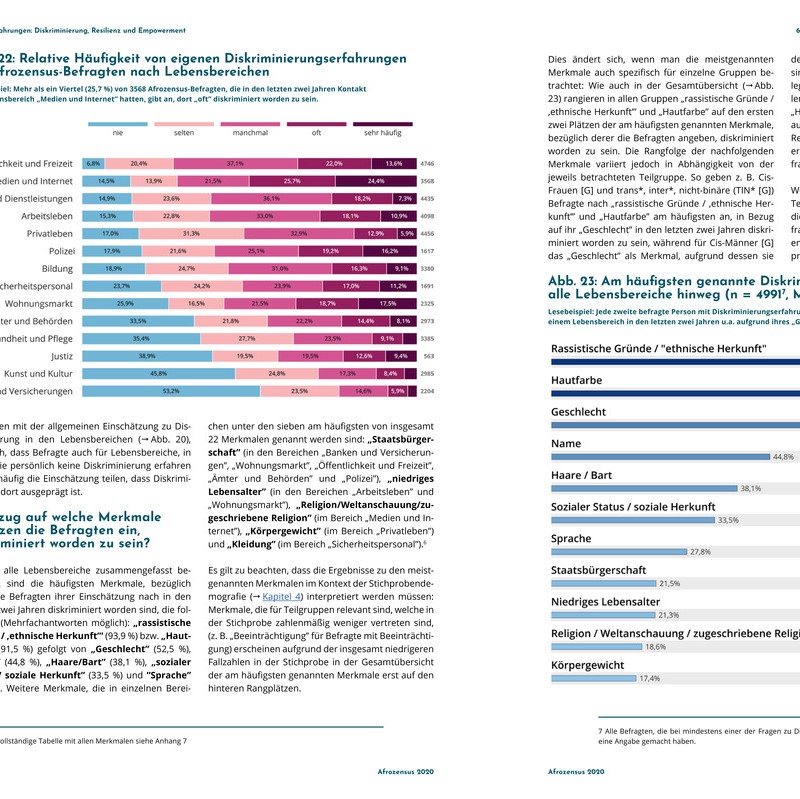
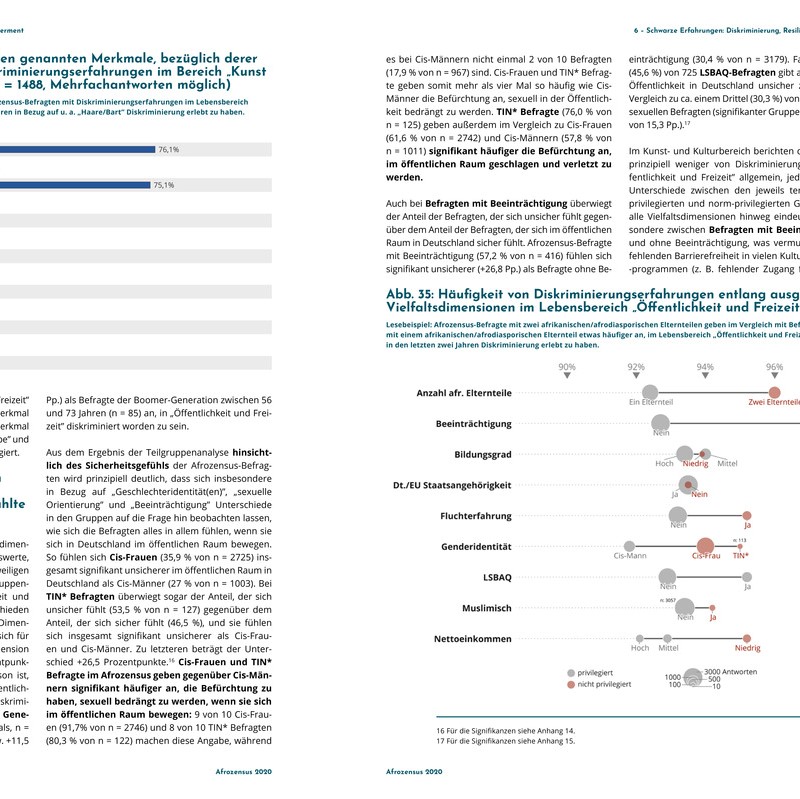
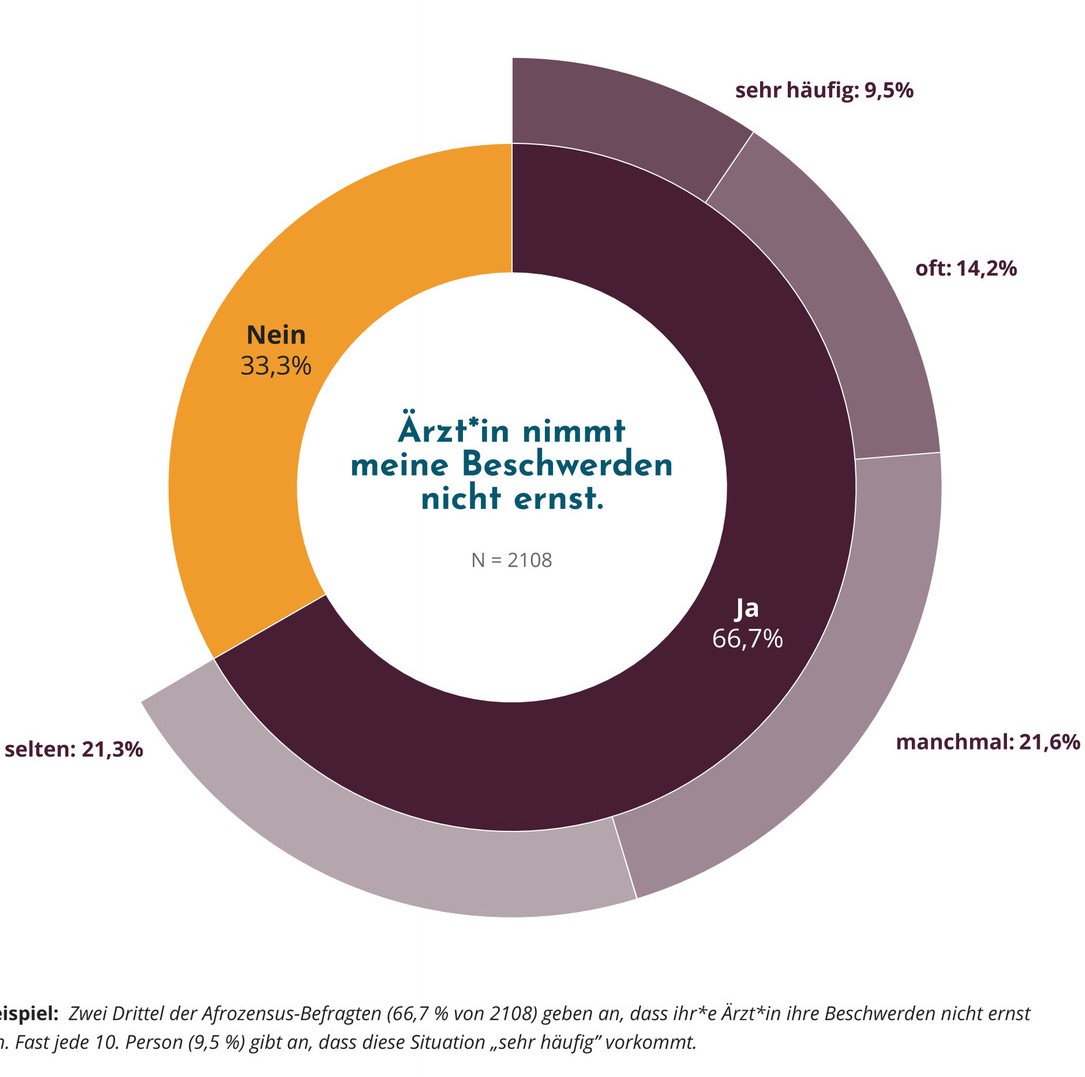
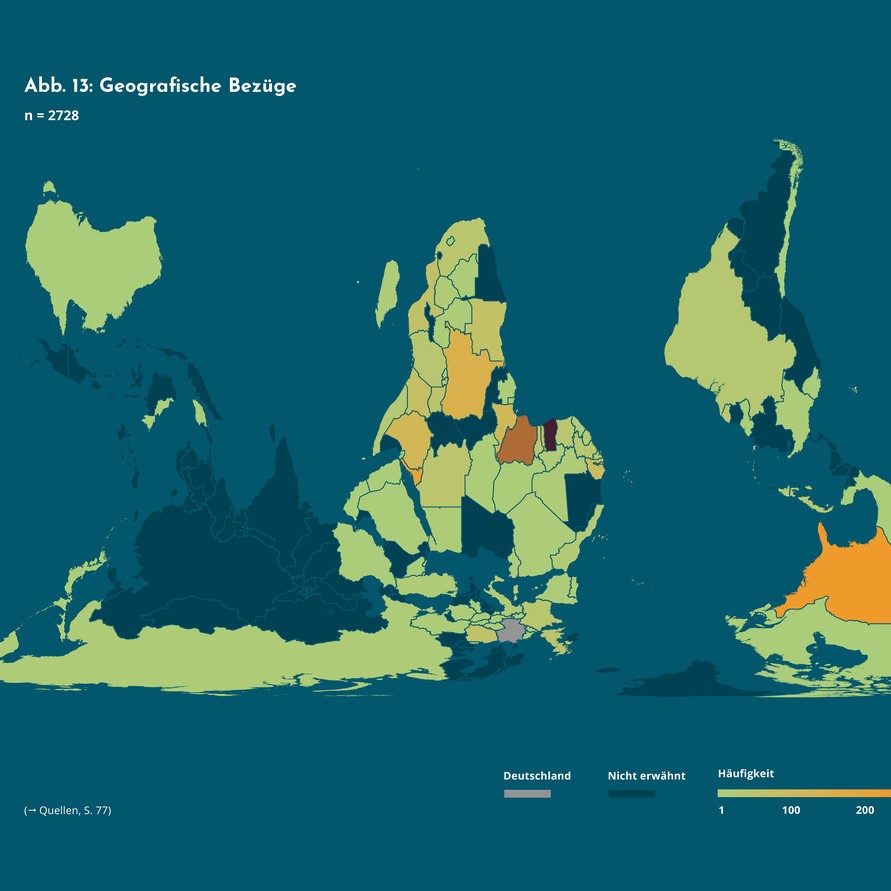
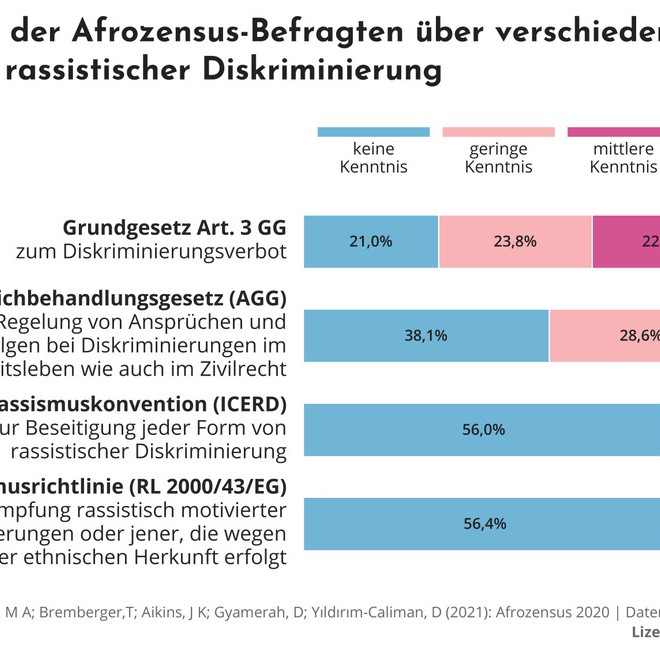
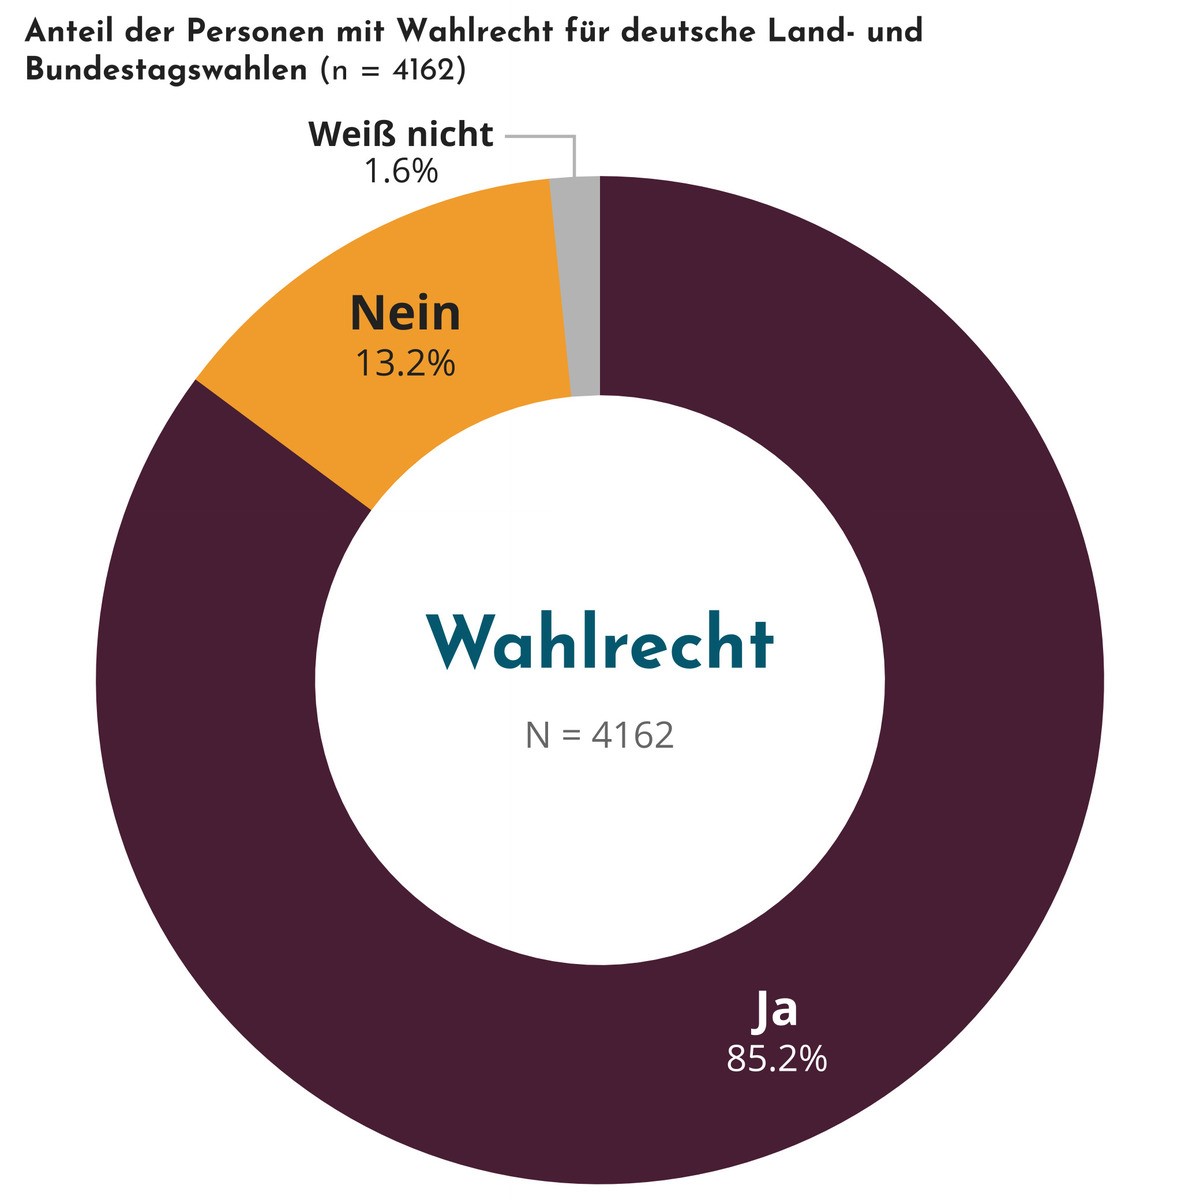
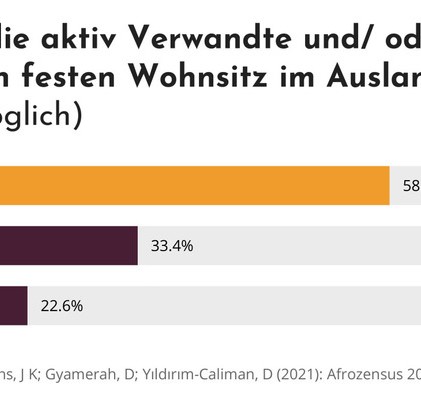
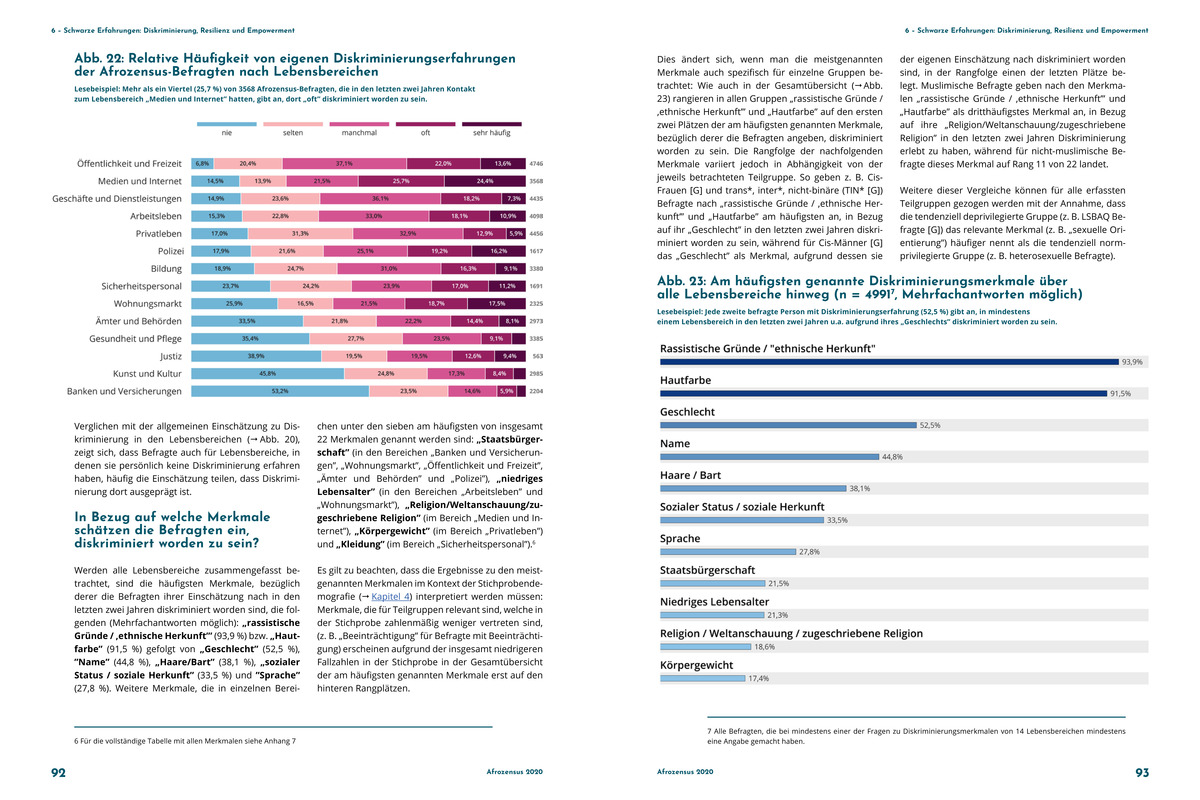
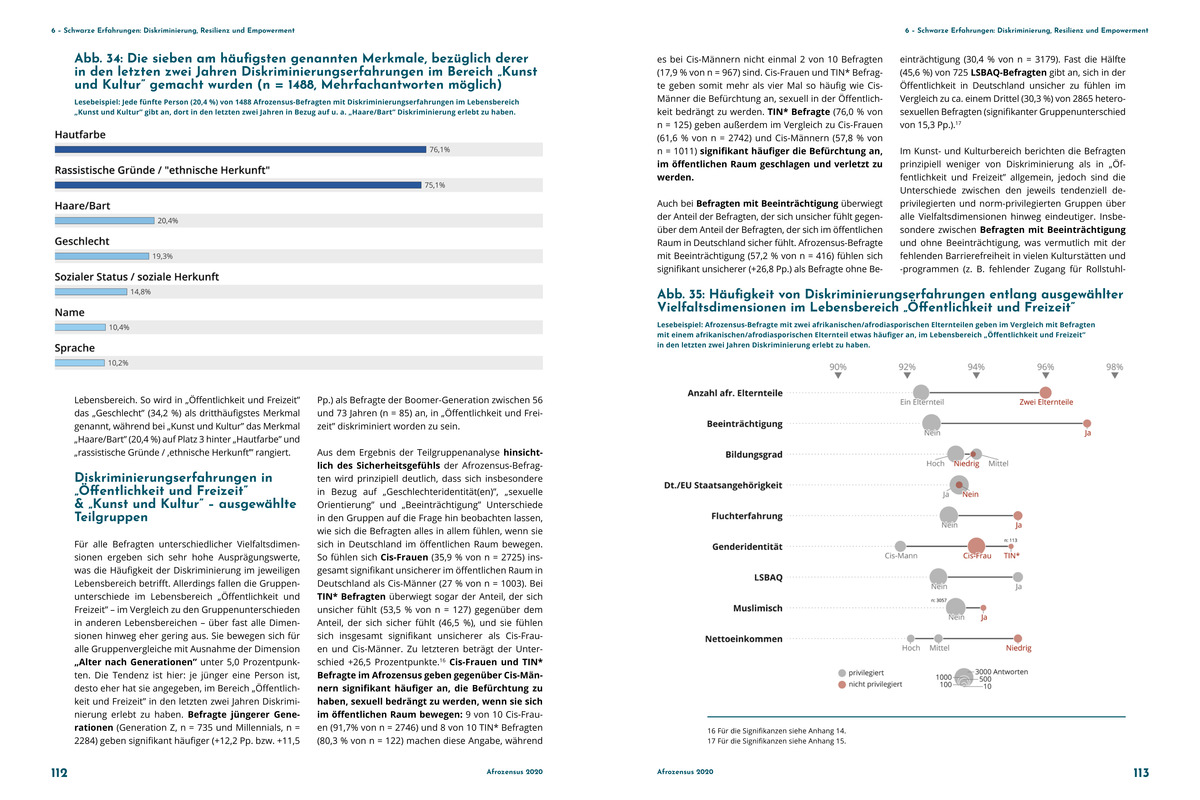
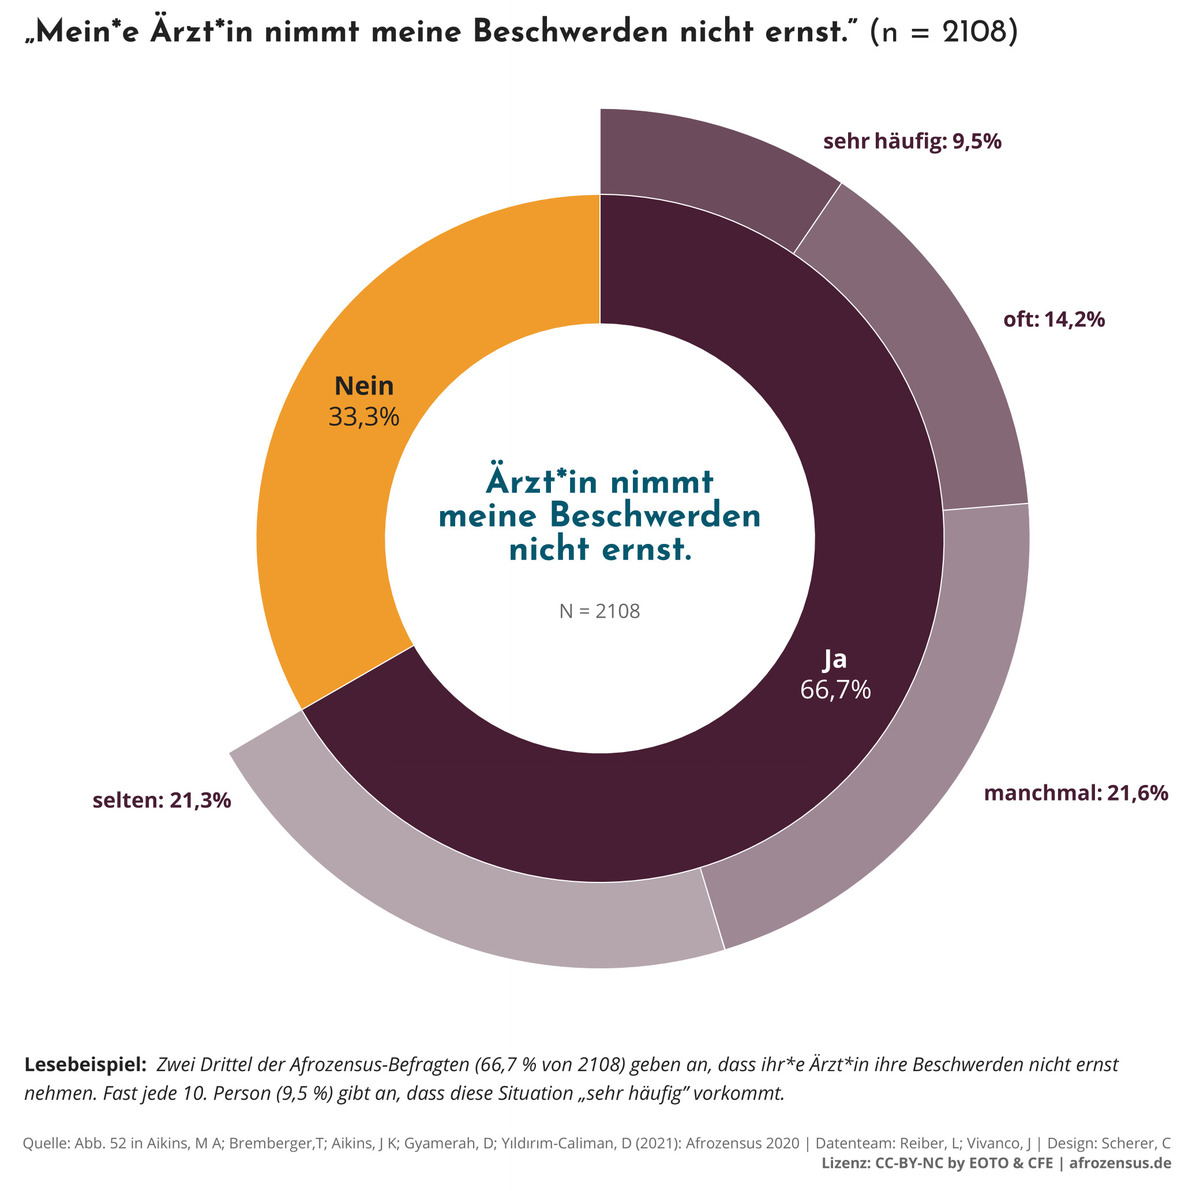
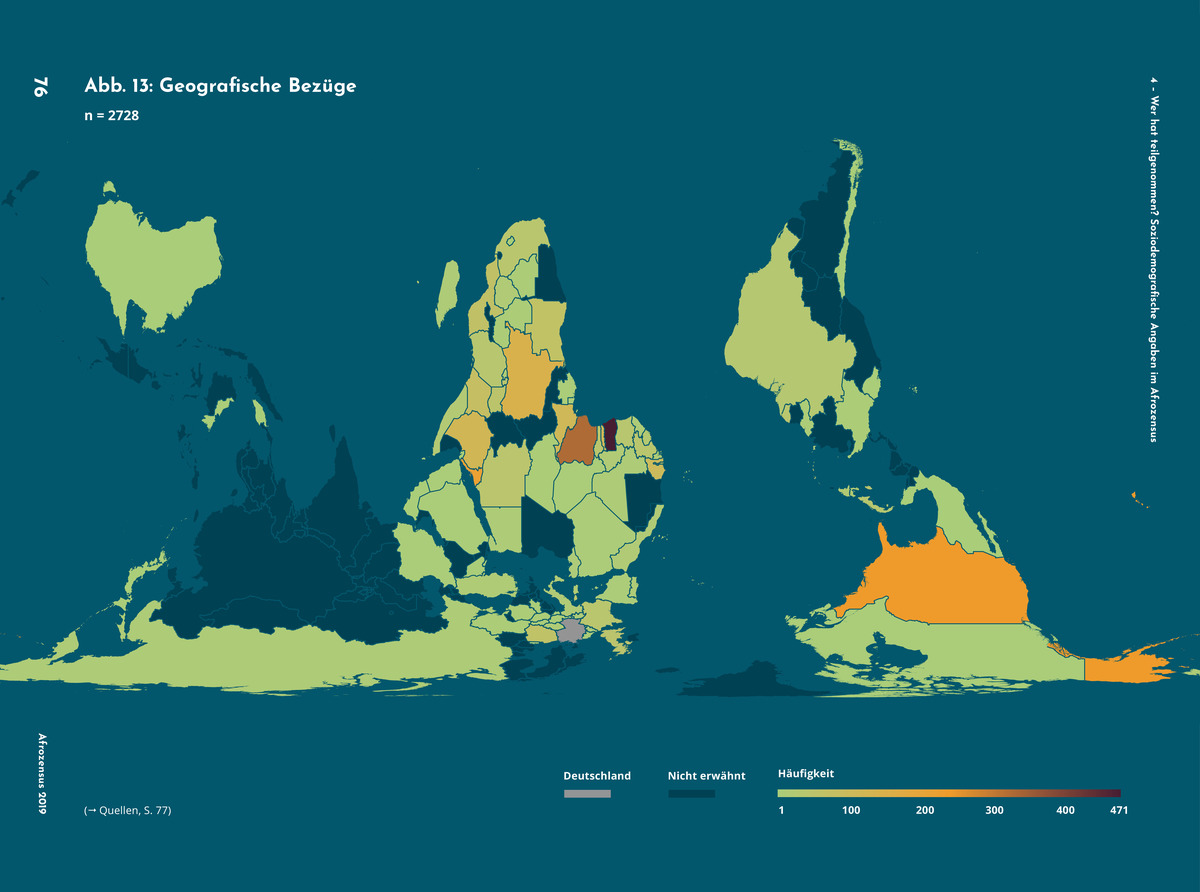
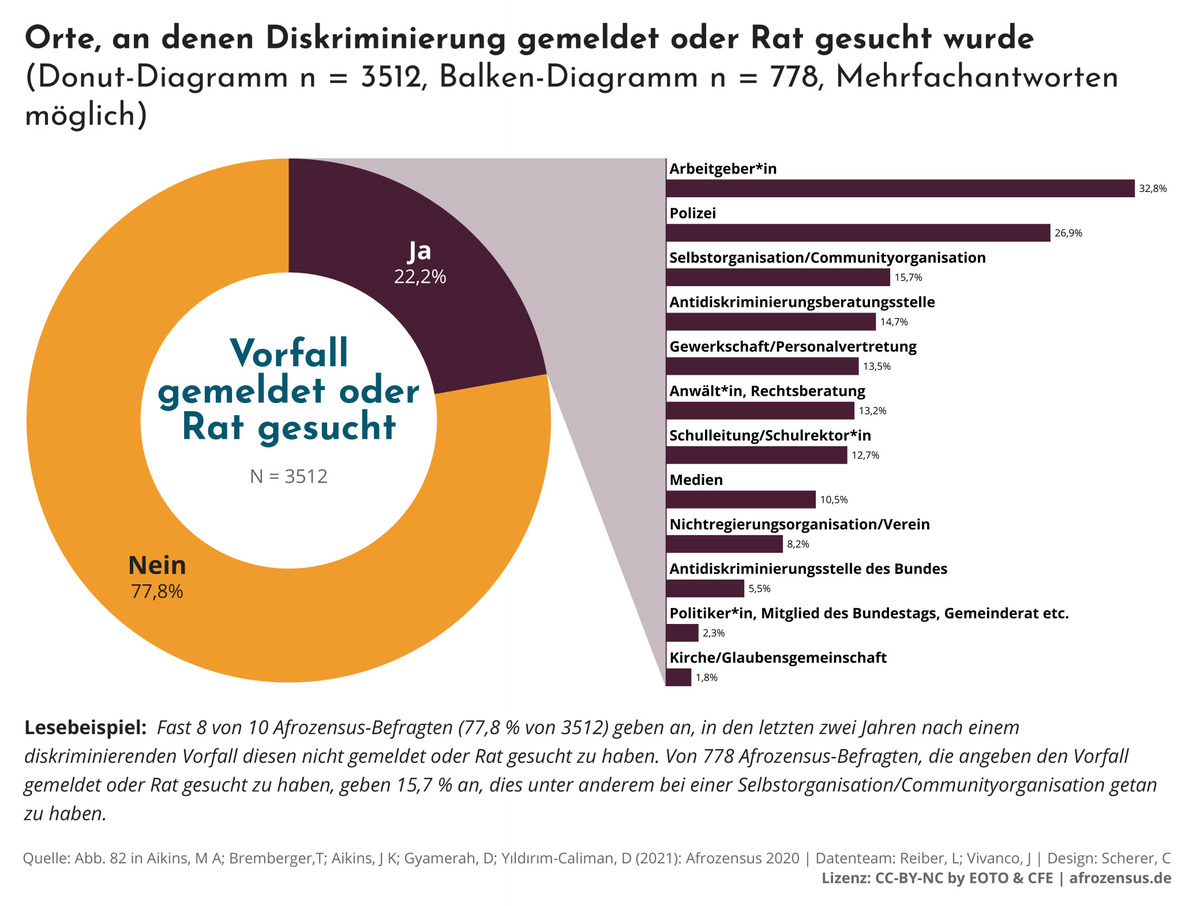
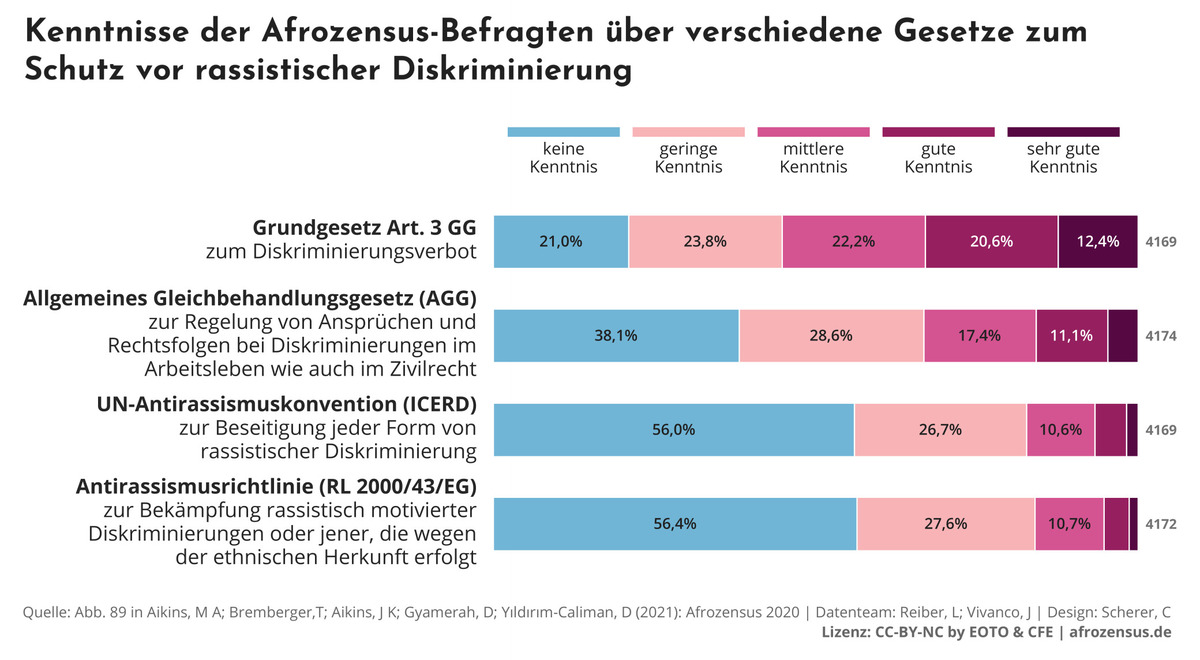
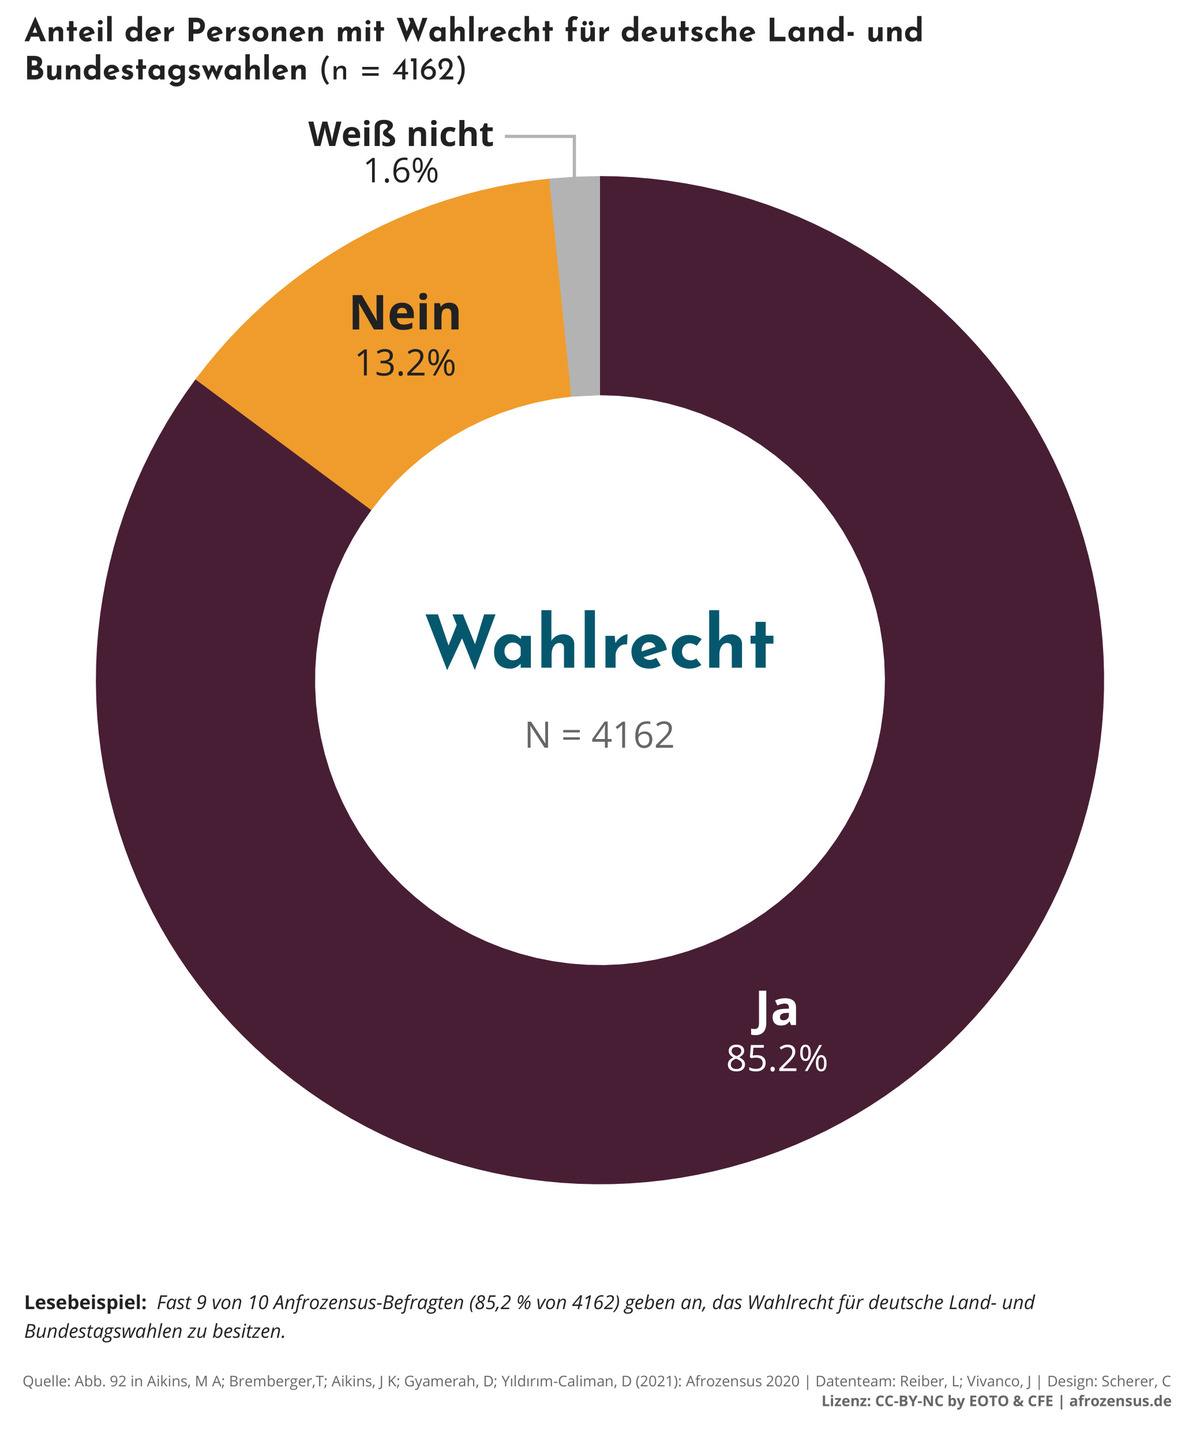
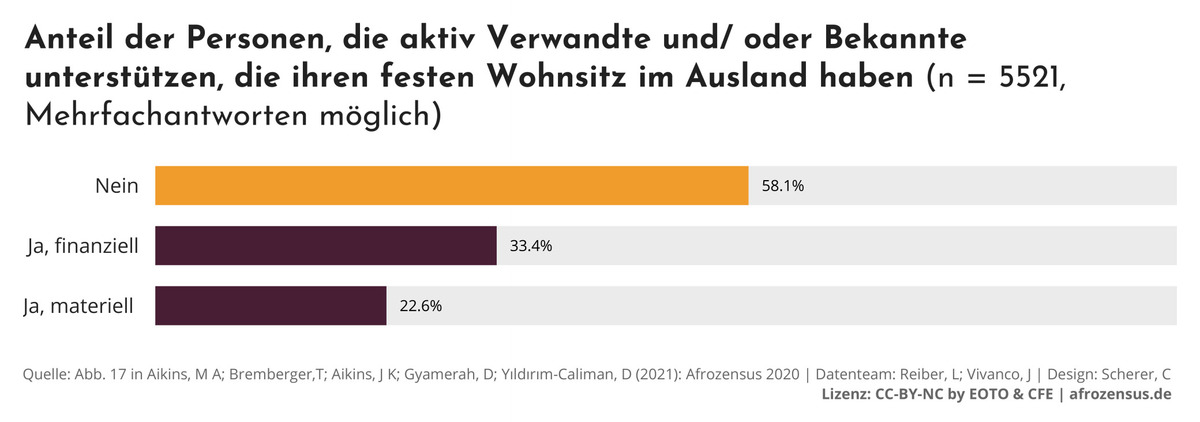
89 data visualizations for the report “Afrozensus 2020” published by EOTO e.V. and Citizen for Europe. The visualizations show the results from the largest survey ever conducted among black, African and Afrodiasporic people in Germany.
1 Report Abb 22 und 23 Diskriminierungserfahrungen
2 Report Abb 34 und 35 Diskriminierungserfahrungen Kunst Freizeit
4 Abb 52 AZ Situation Arzt mit Lesebsp
5 Abb 13 Geografische Bezuege Report
6 Abb 82 AZ Diskriminierung Umgang Meldeort mit Lesebsp
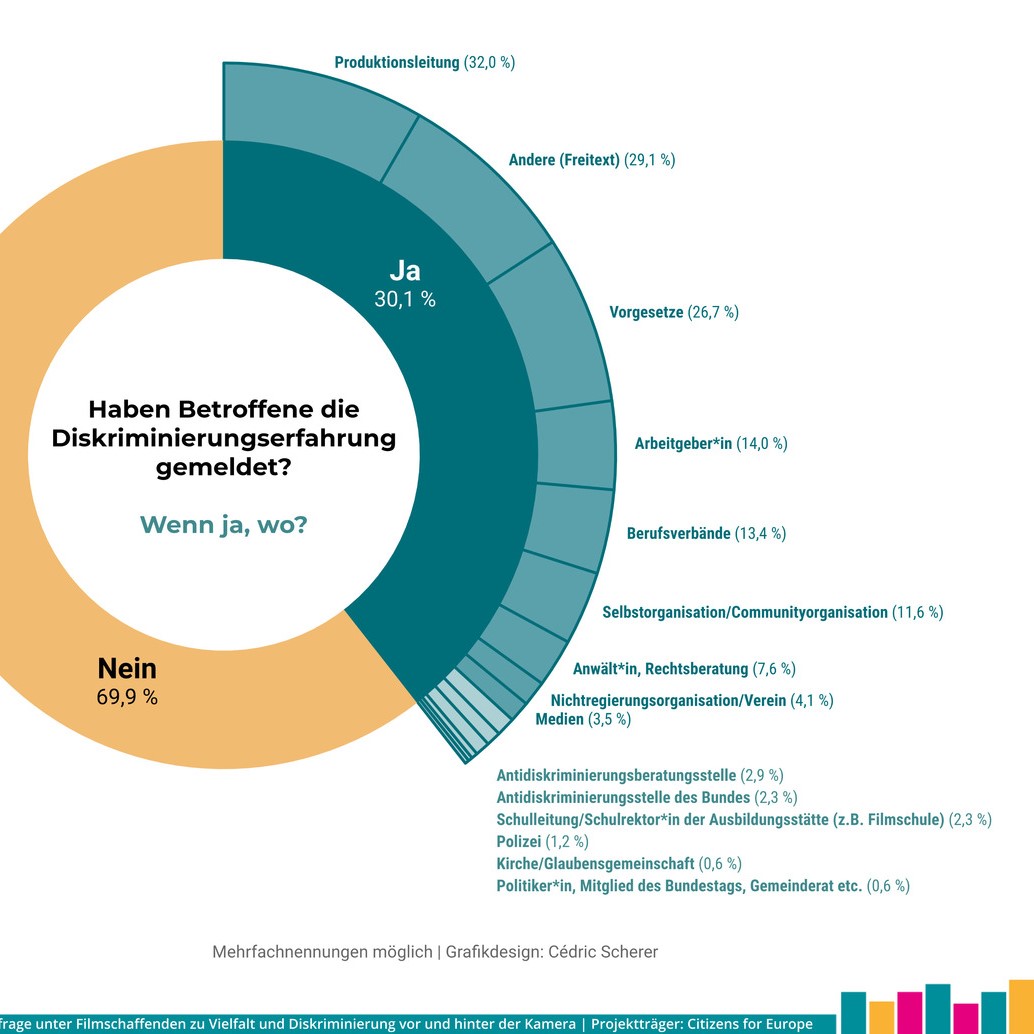
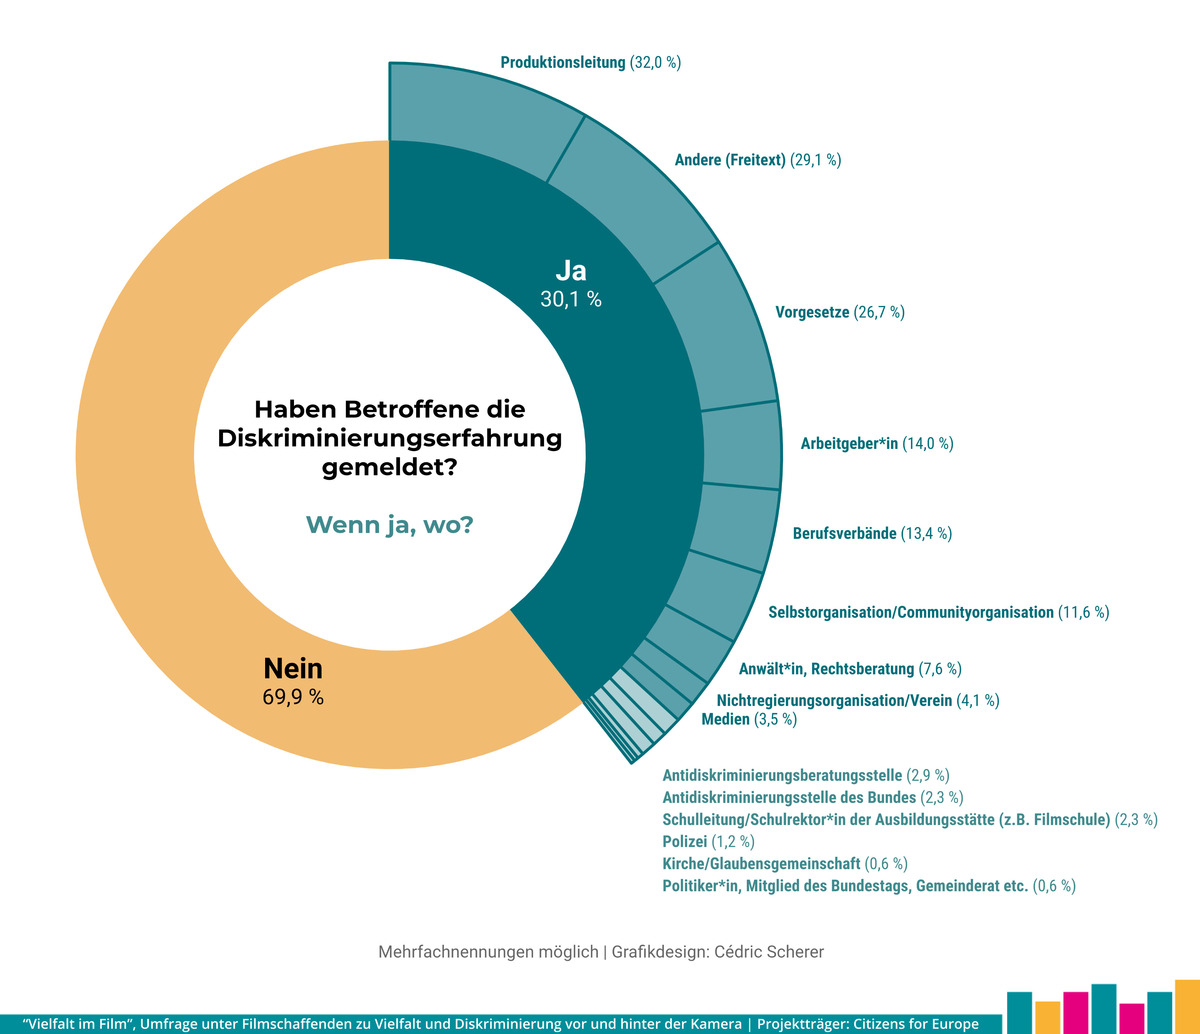
CitizensForEurope Vielfalt Im Film Diskriminierungserfahrung
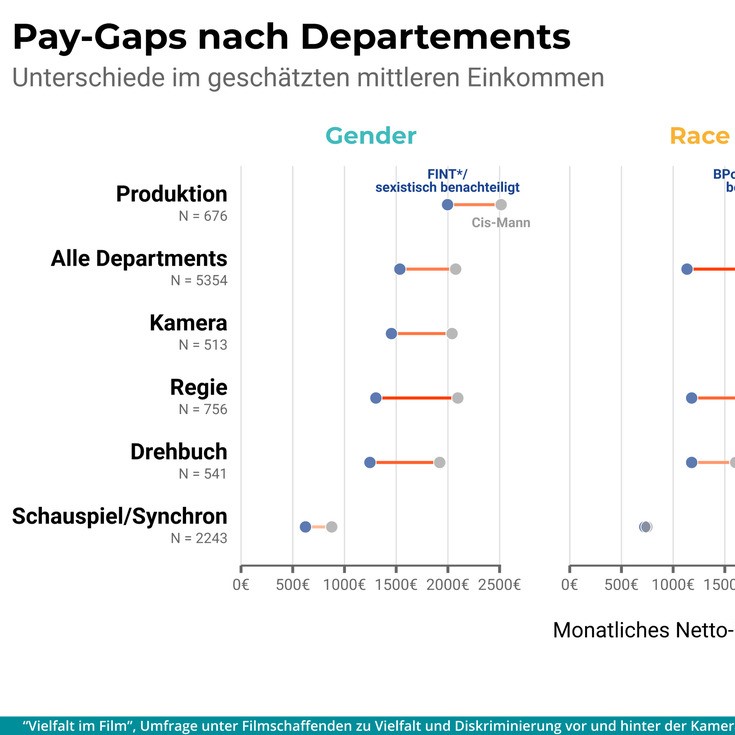
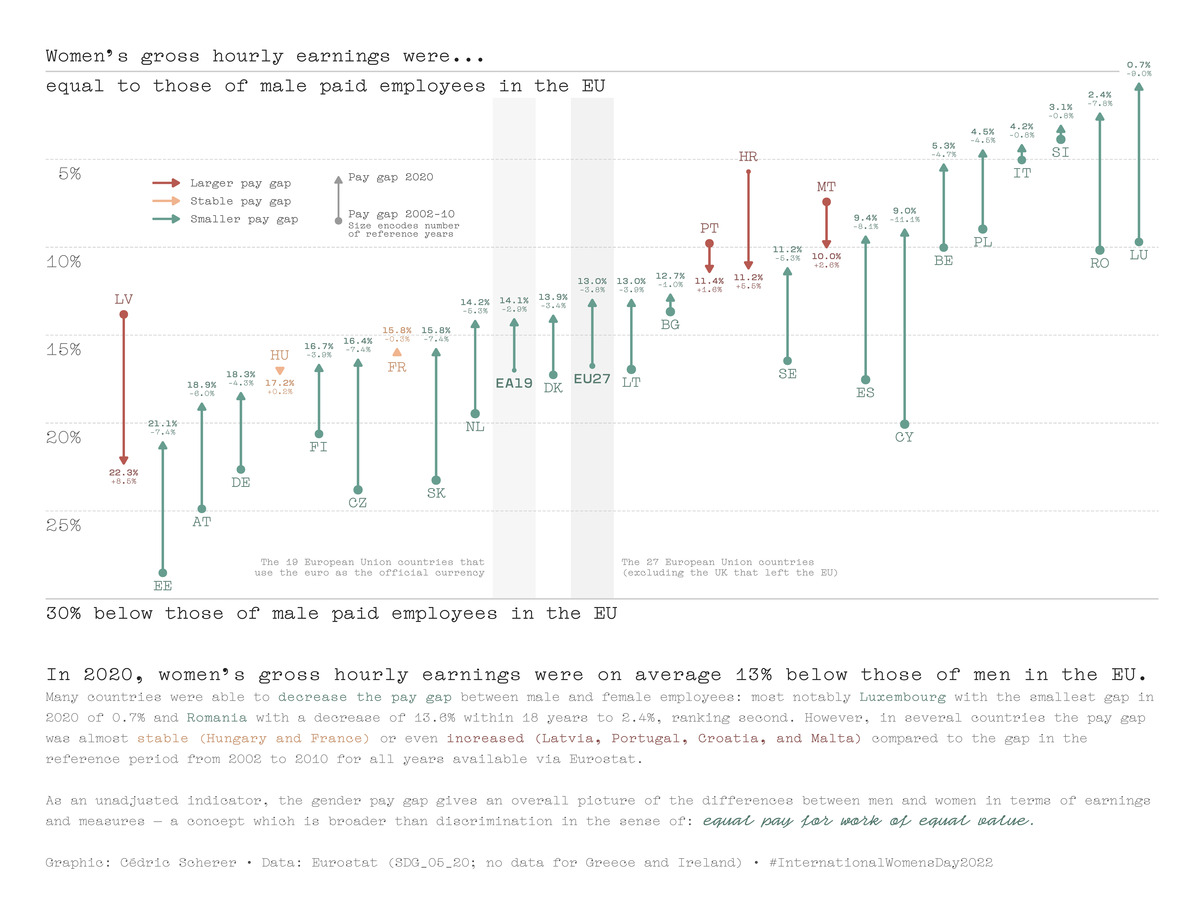
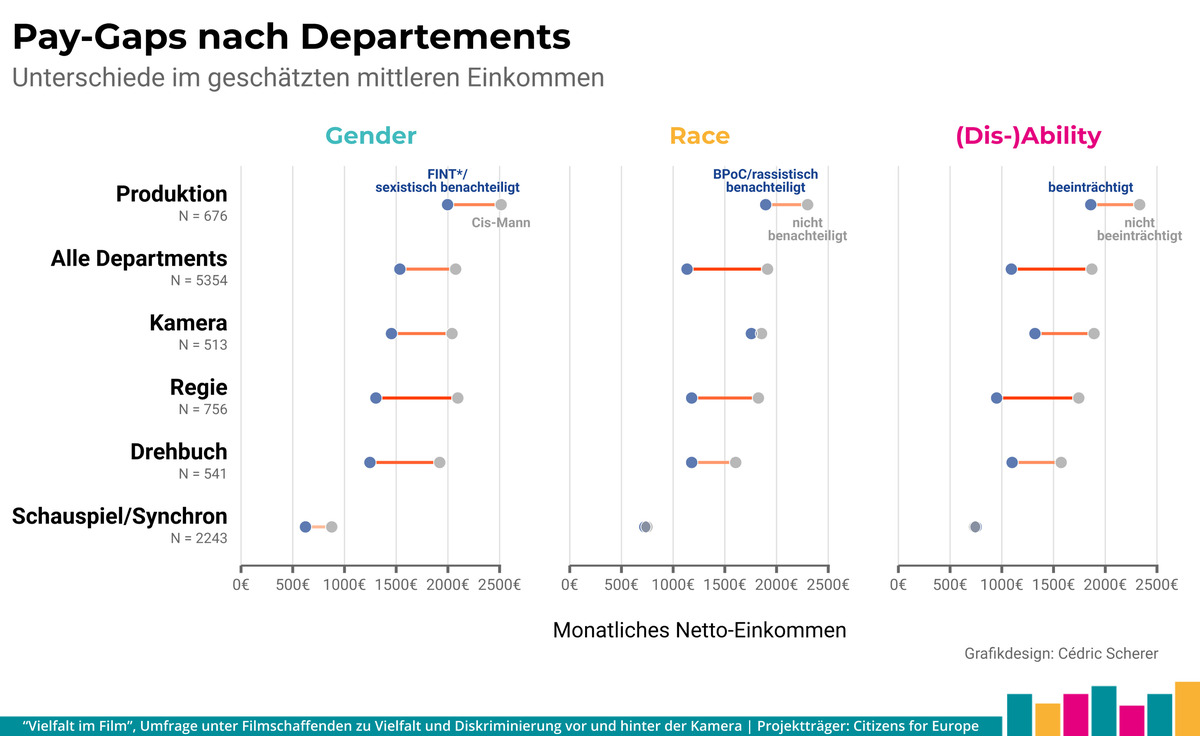
CitizensForEurope Vielfalt Im Film Paygap
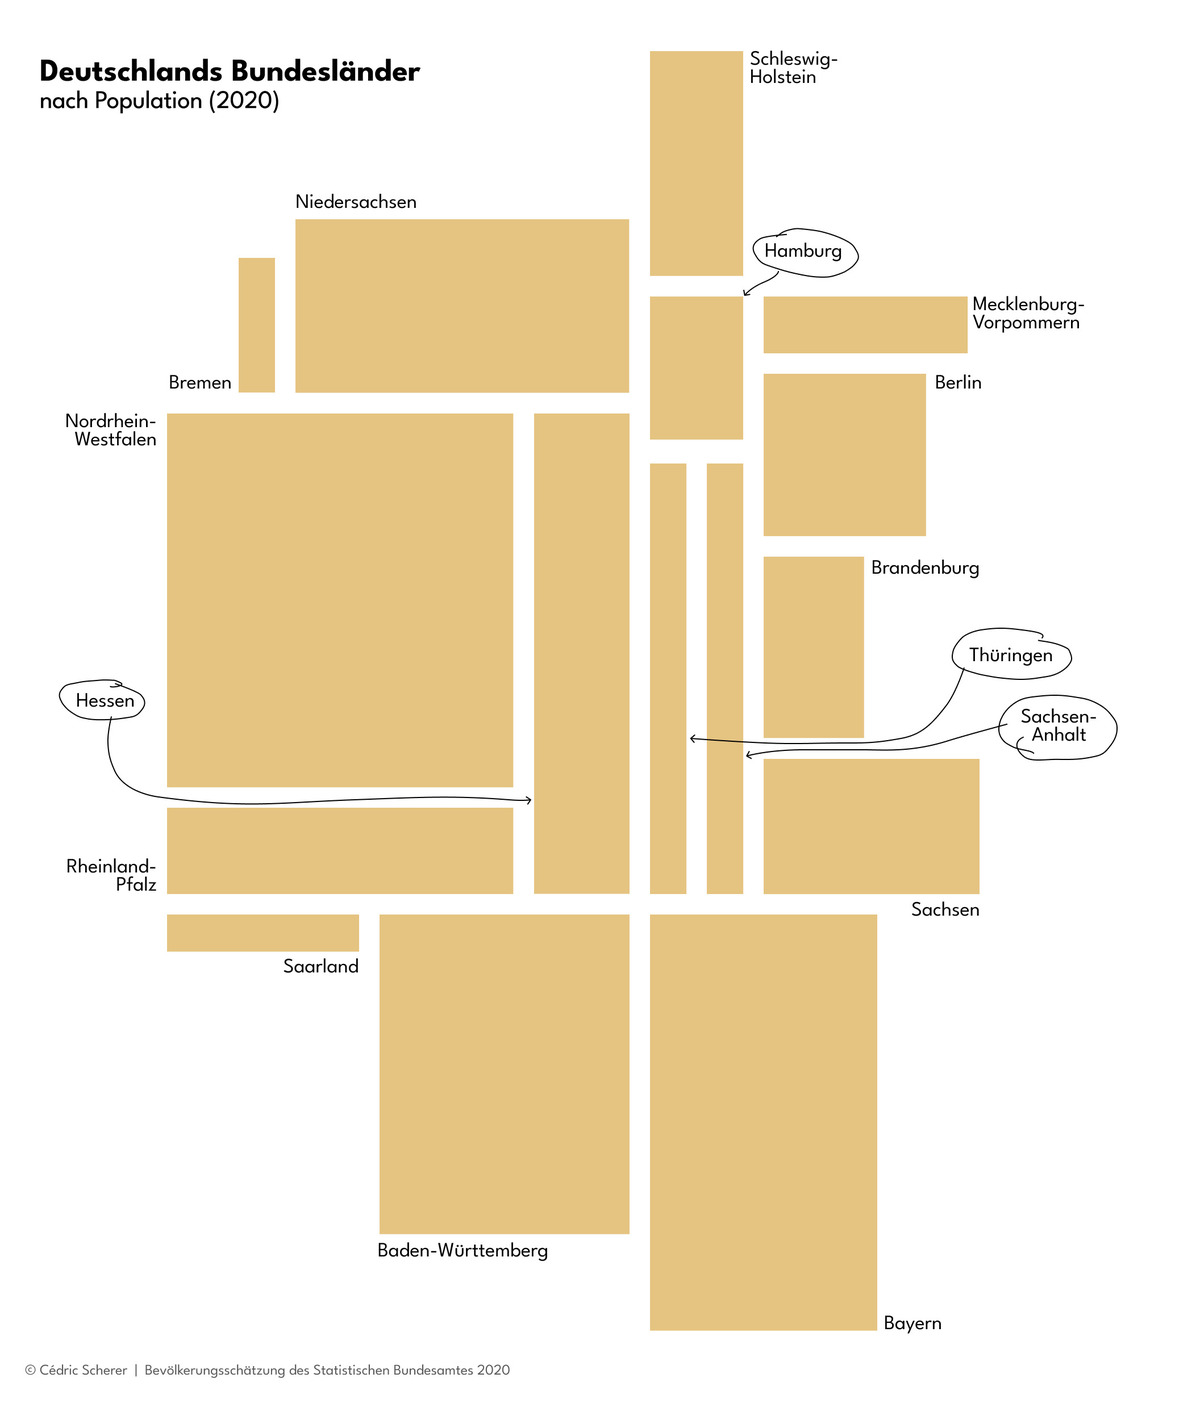
EOTO Germany Packed Rectangles
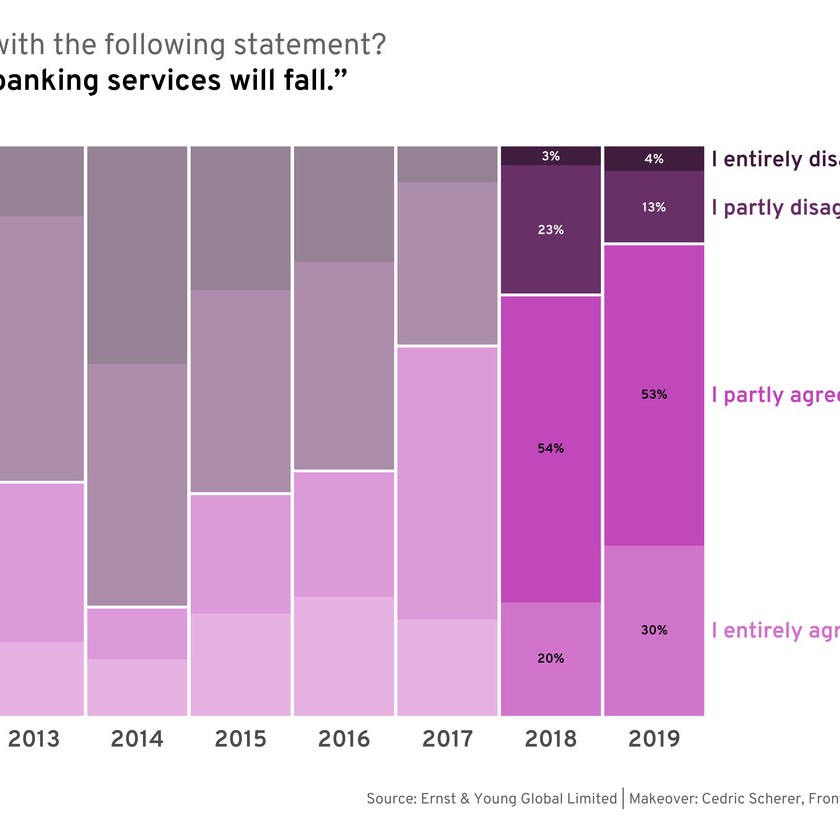
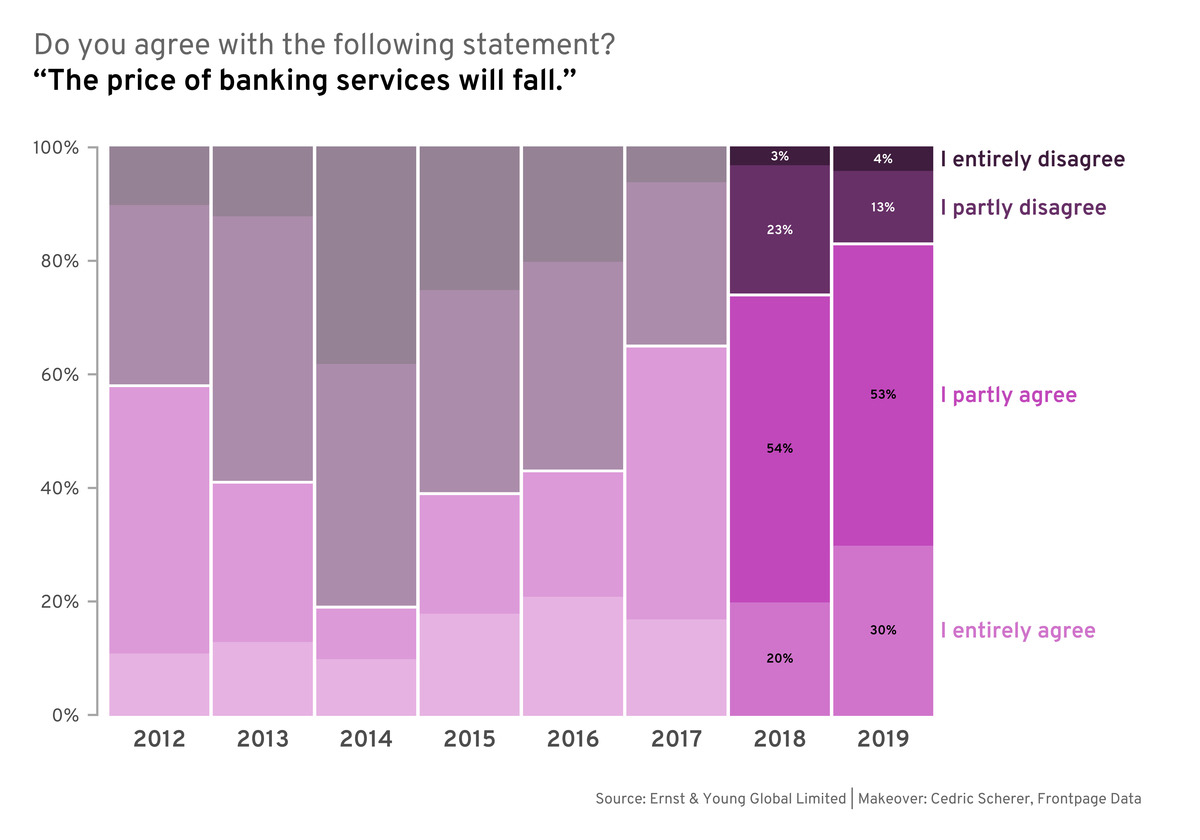
FrontPage Makeover EandY Survey
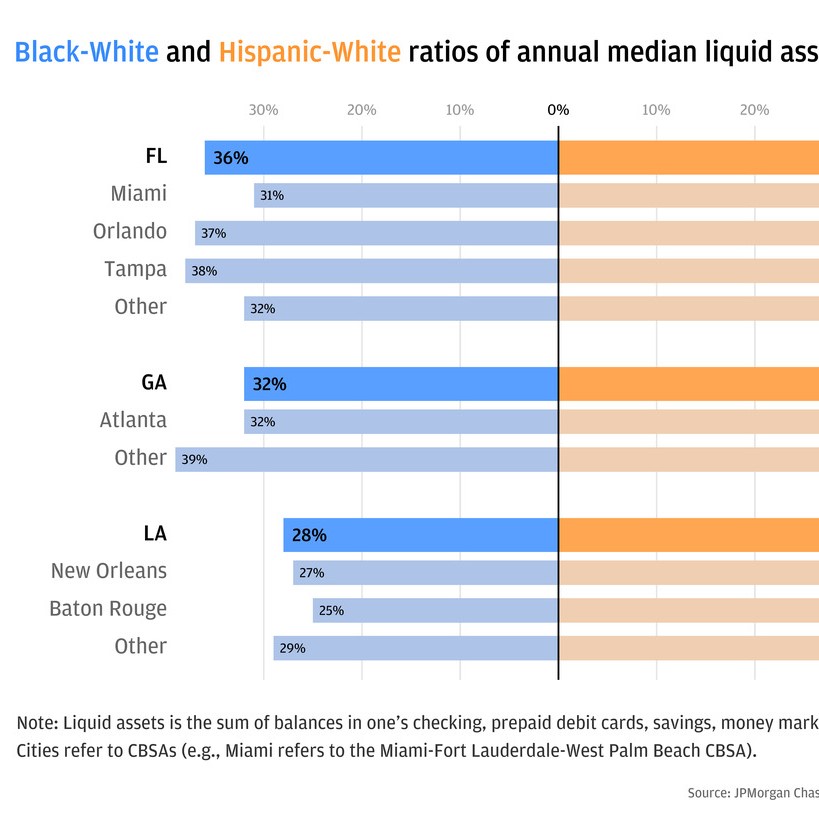
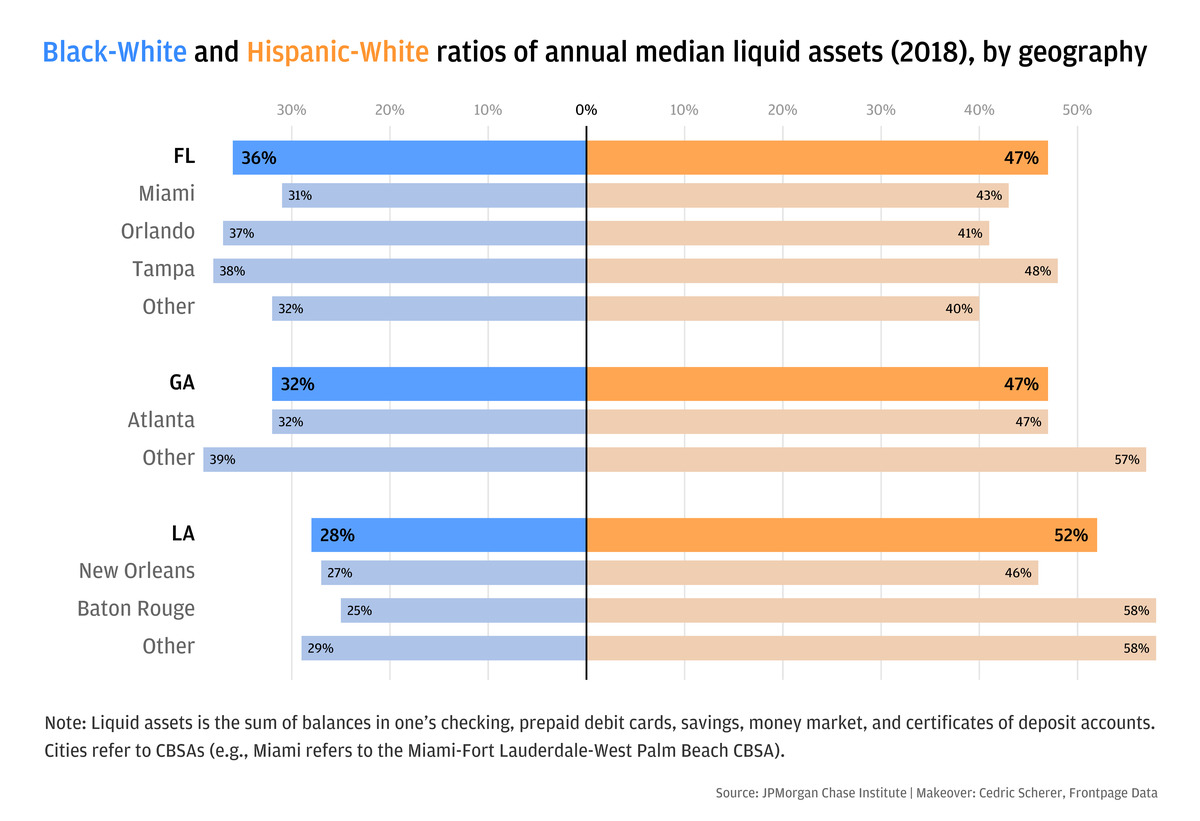
FrontPage Makeover JPMorgan Bars Assets
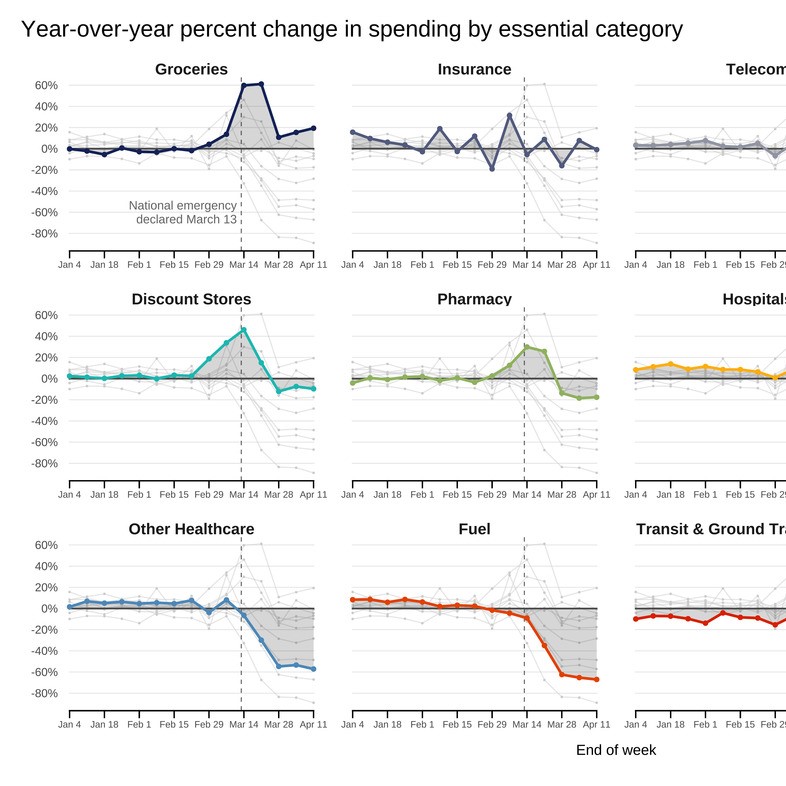
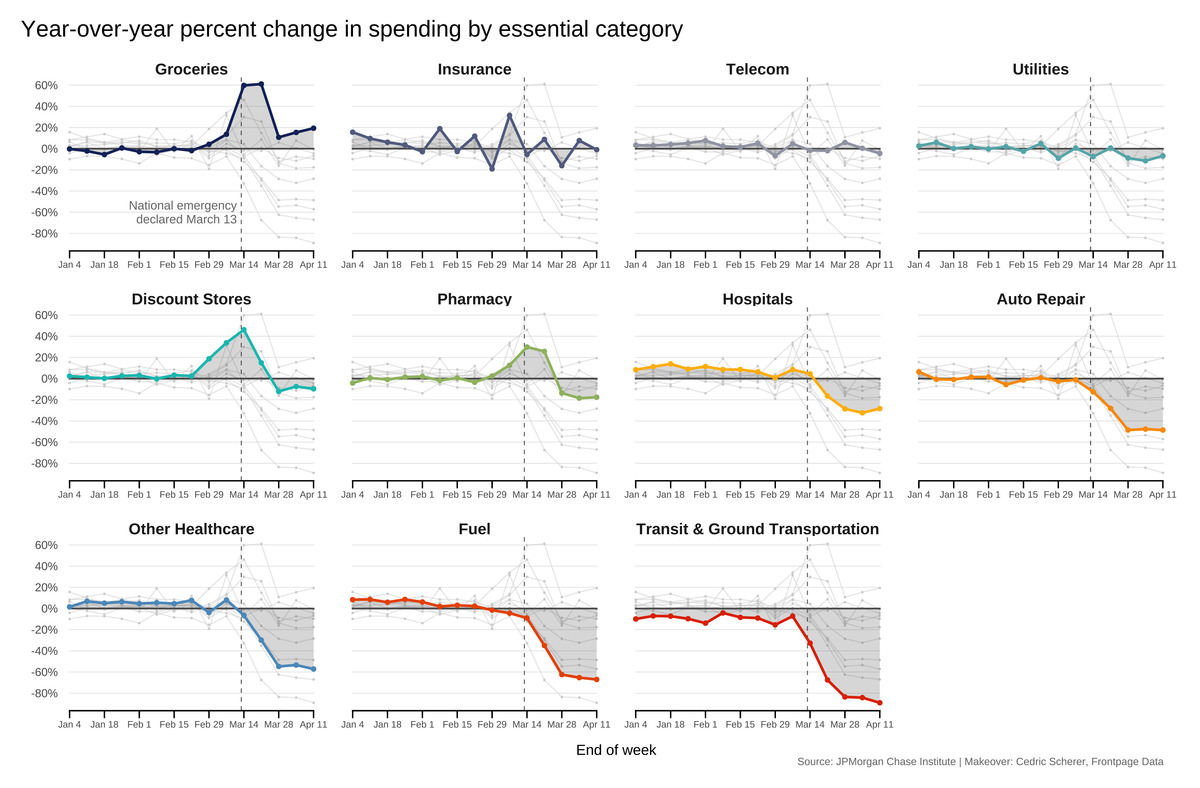
FrontPage Makeover JPMorgan Timeseries
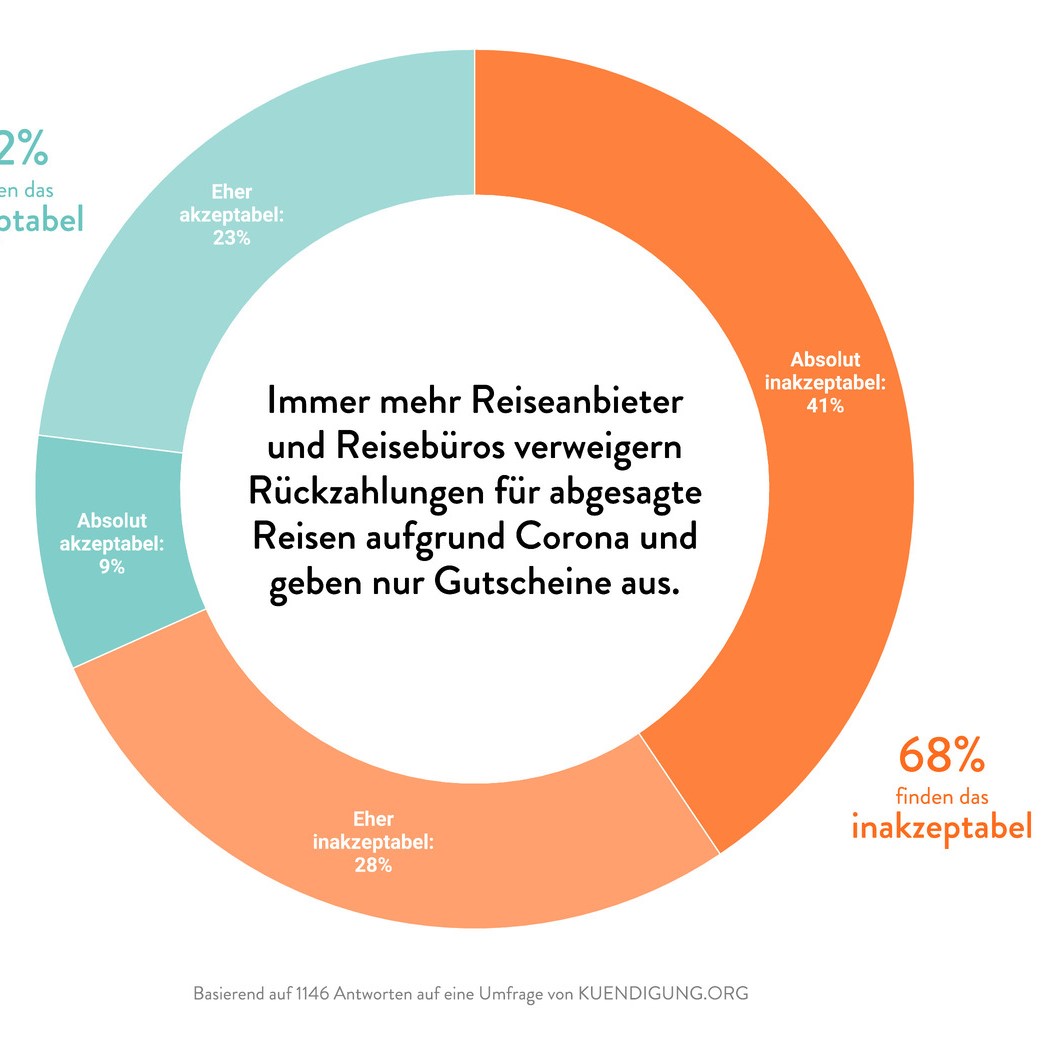
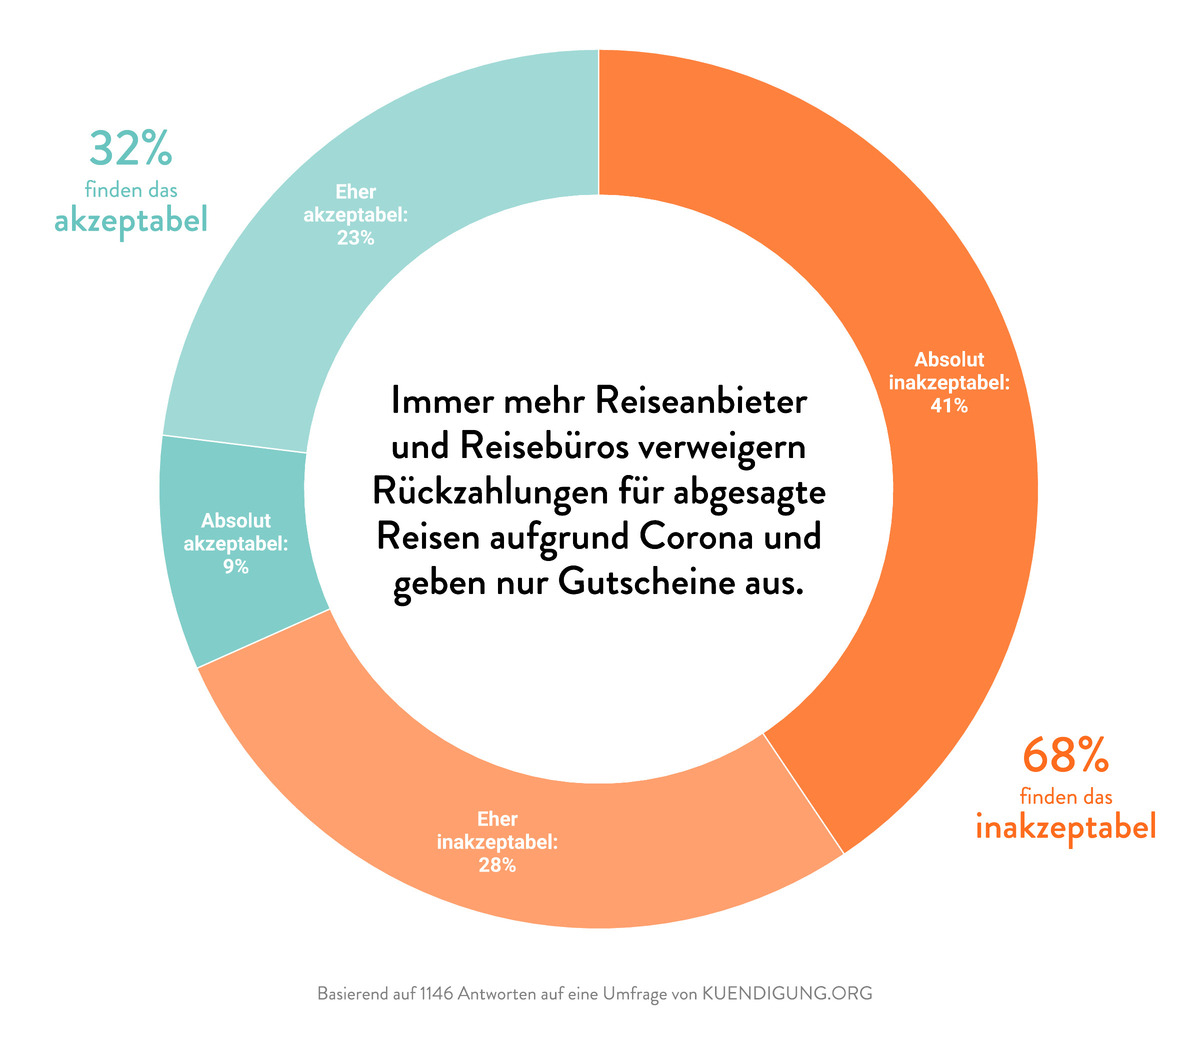
Kuendigungcom Statement Gutschein
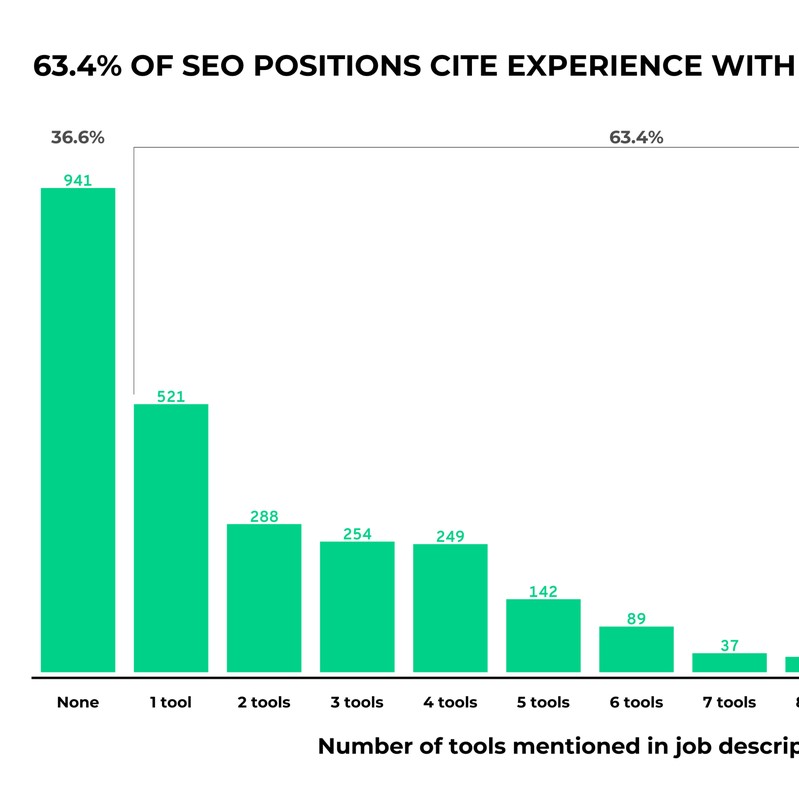
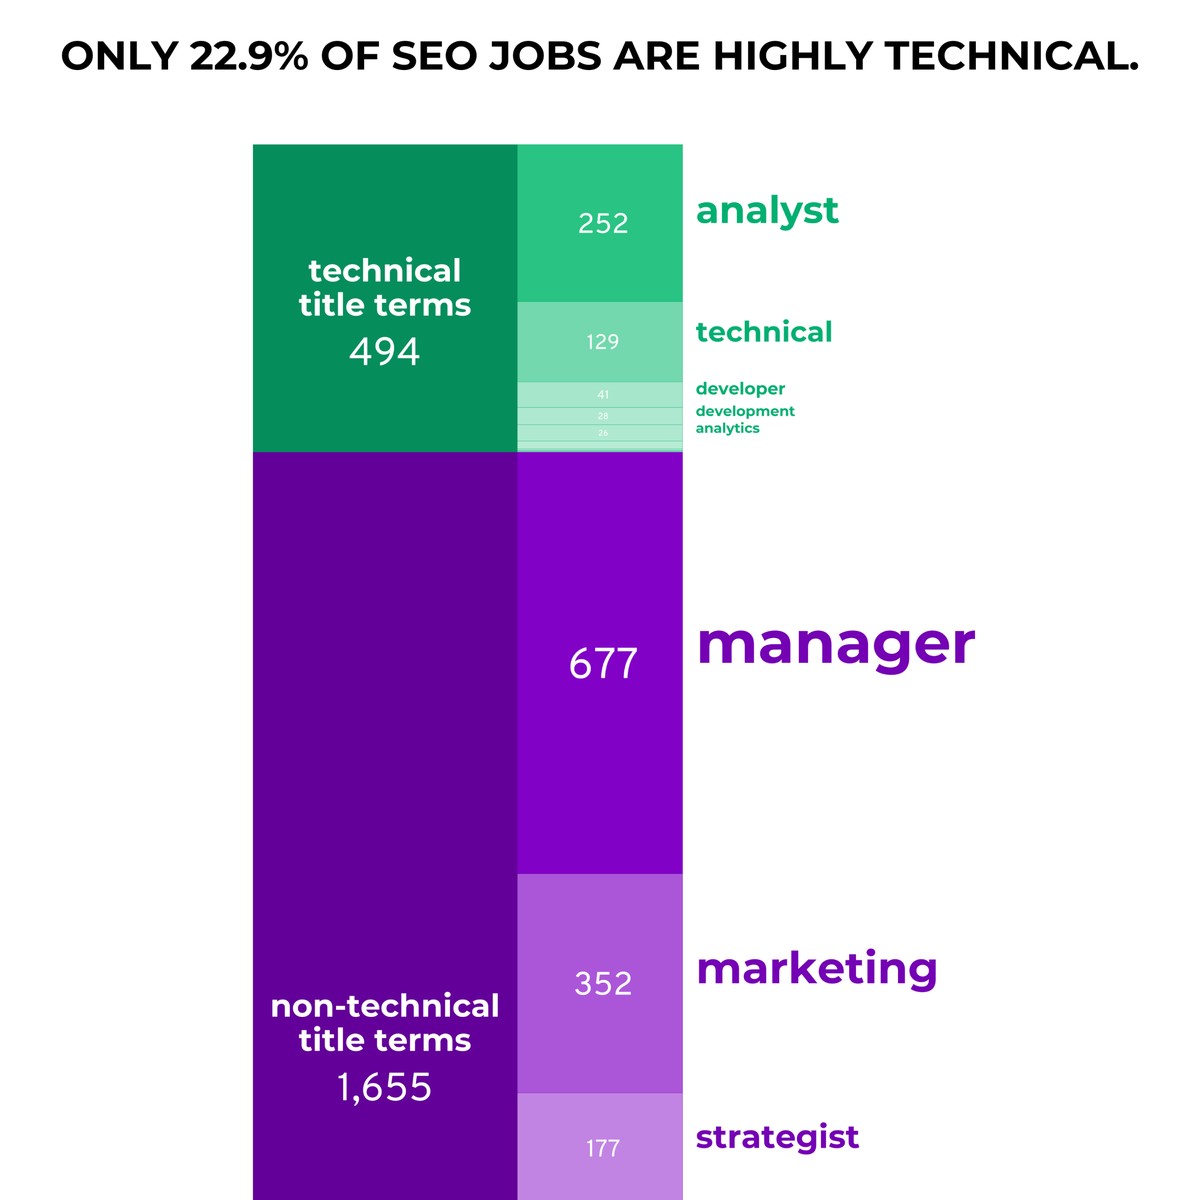
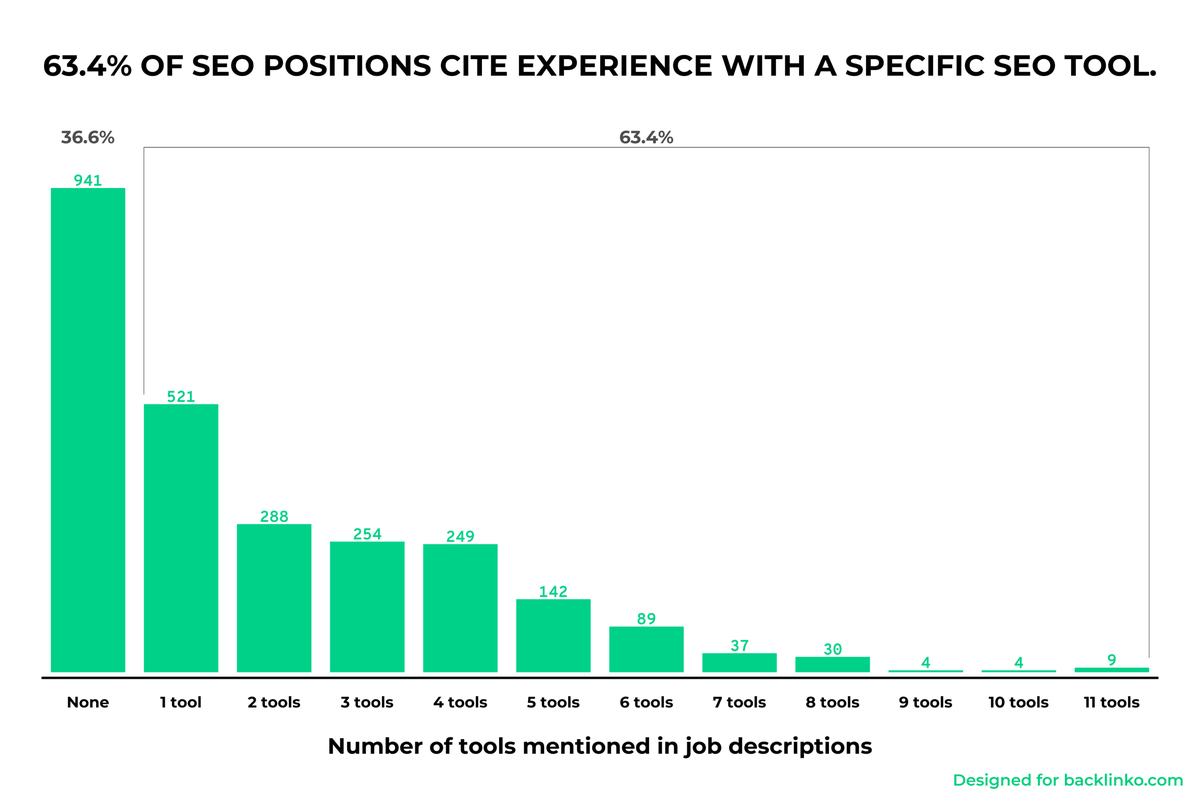
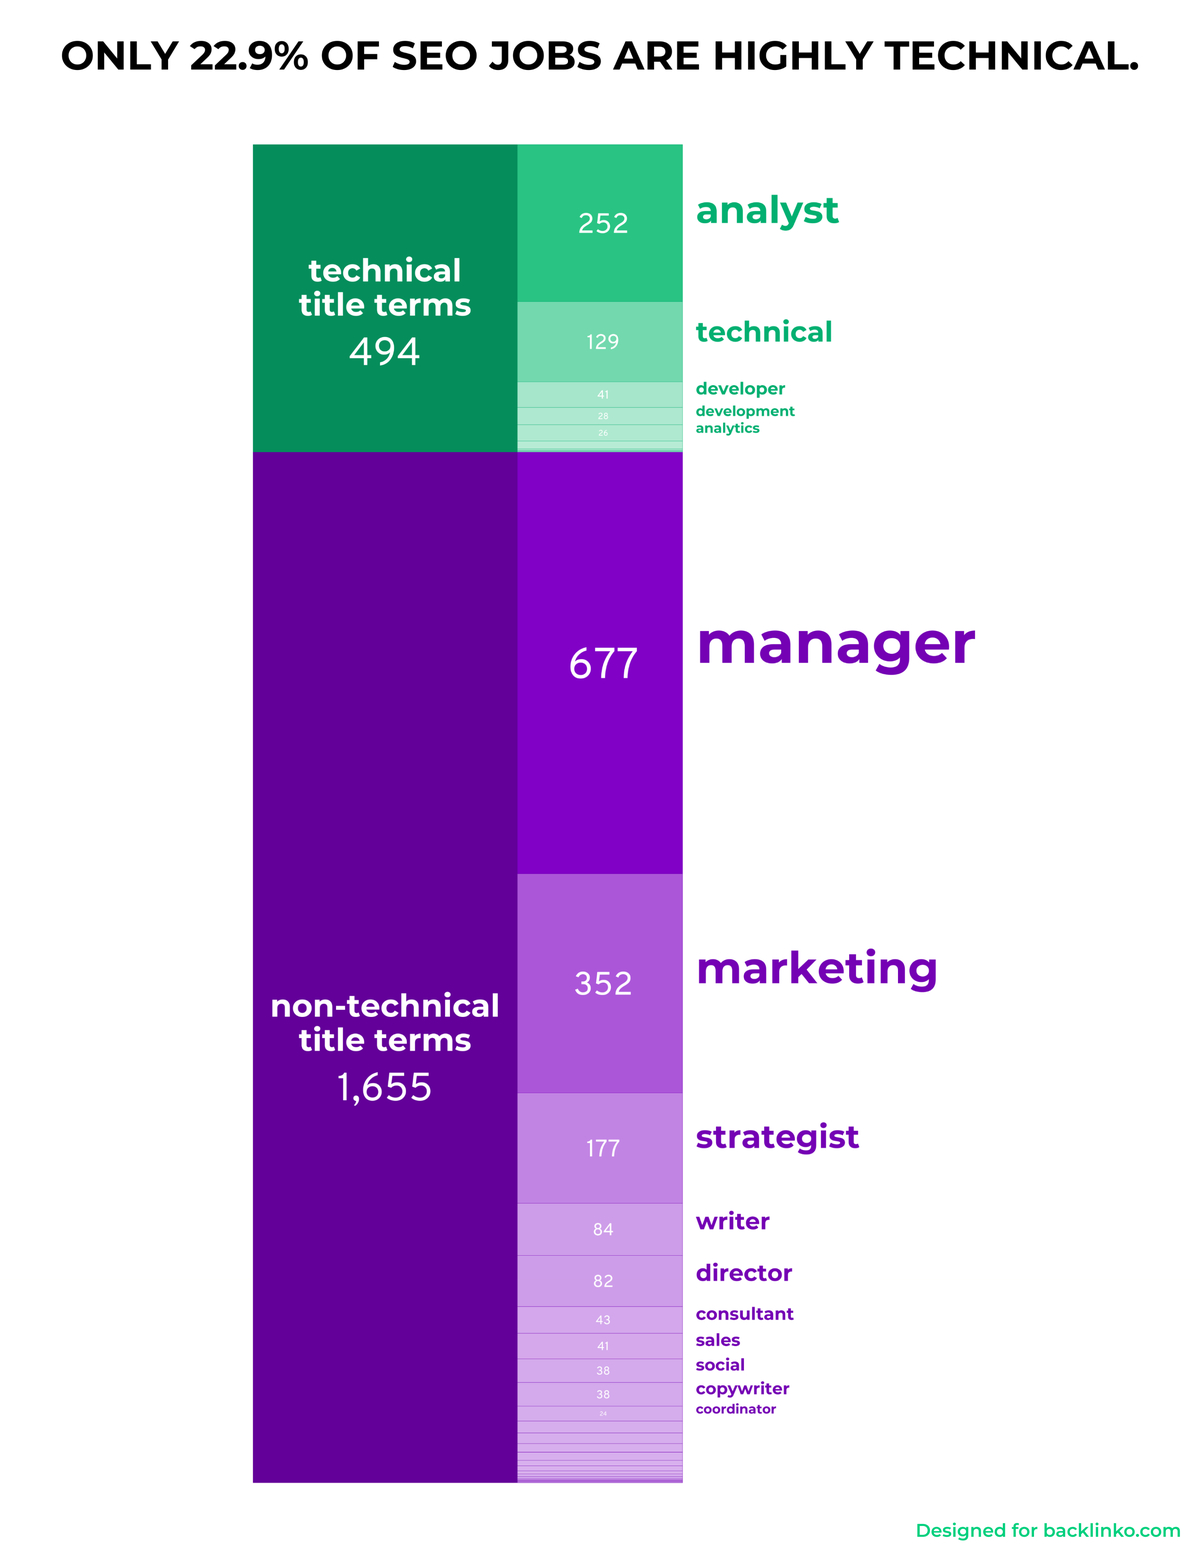
backlinko jobs tech
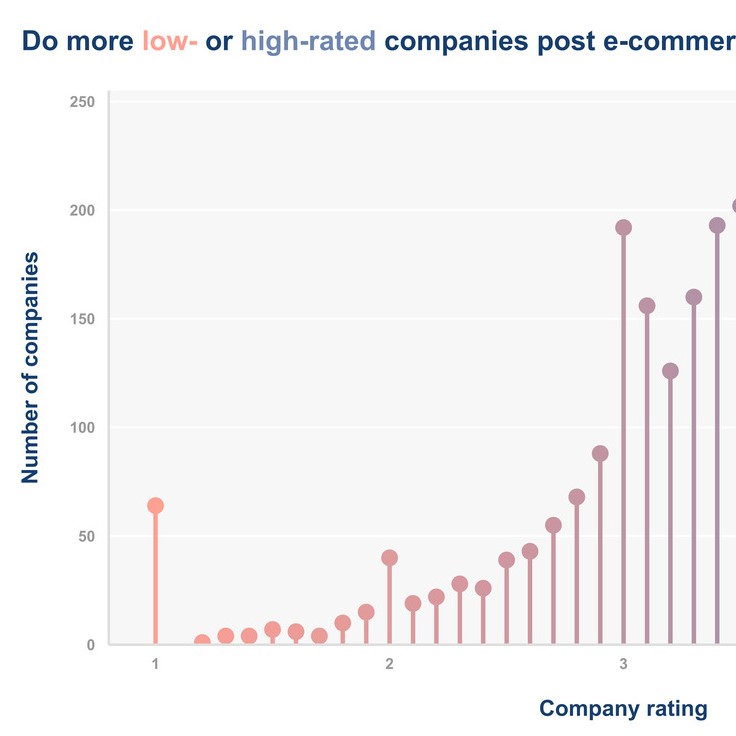
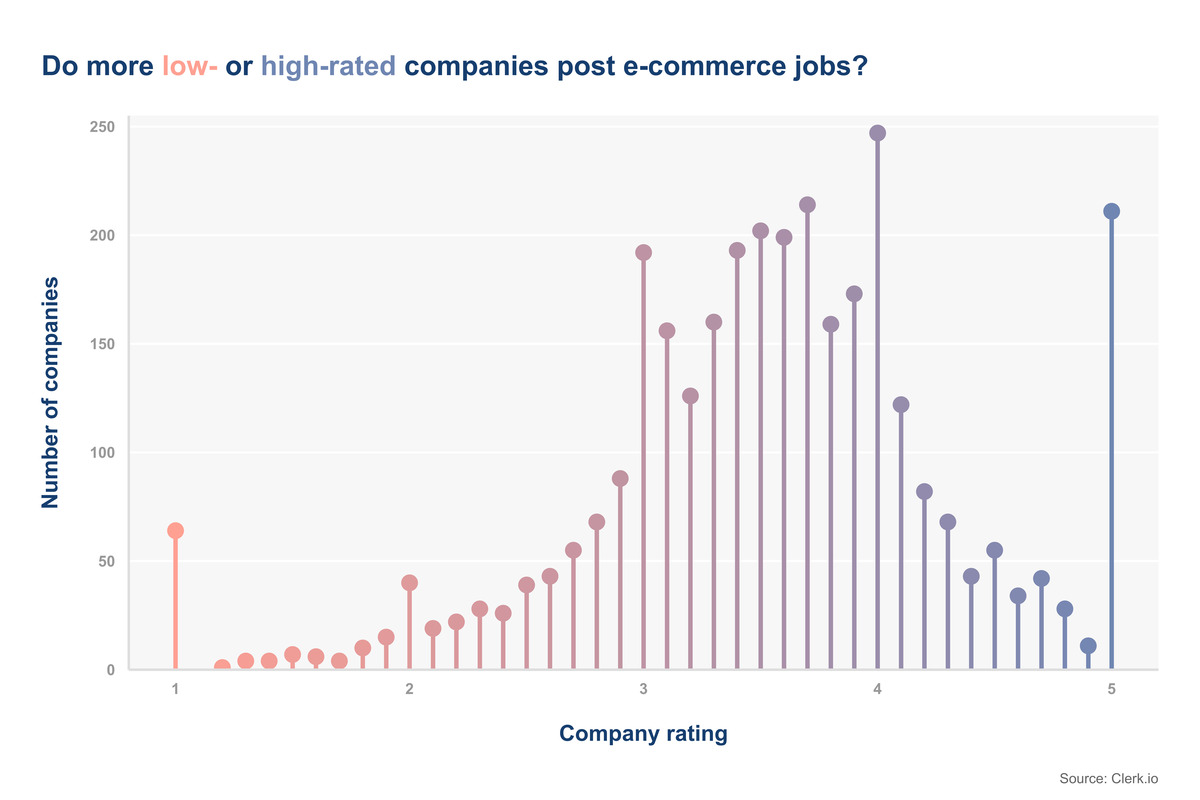
clerkio rating lollipop
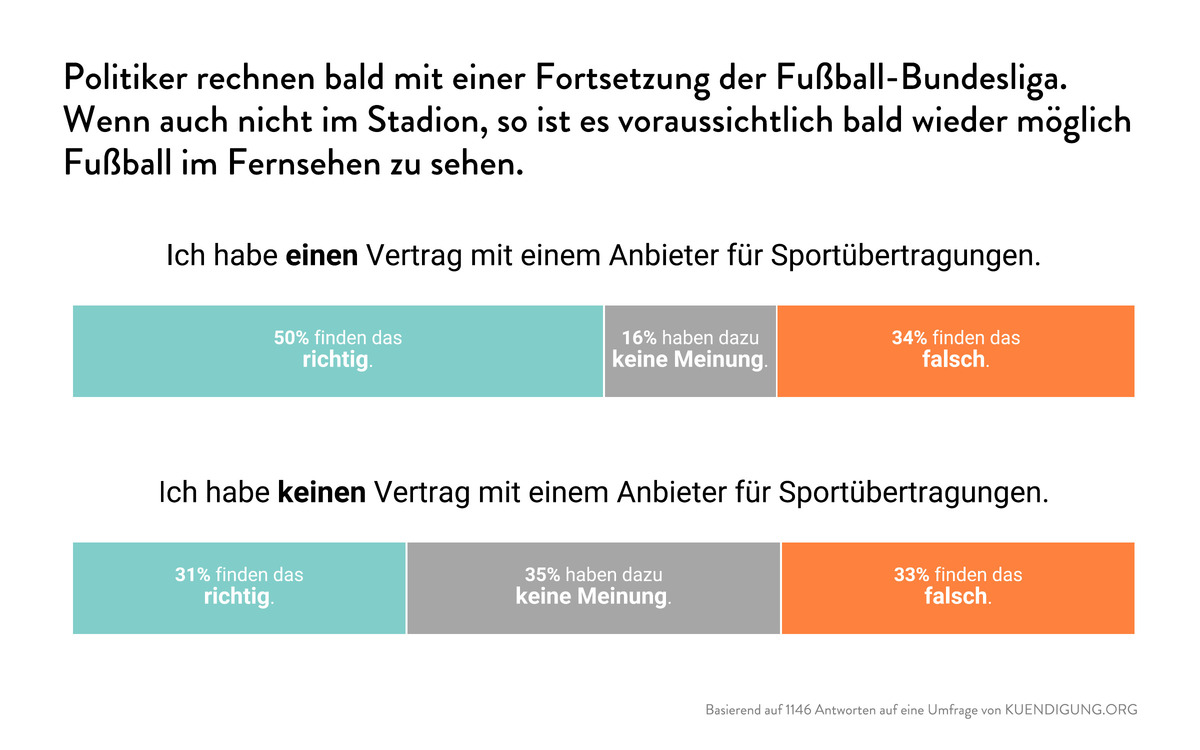
kuendigungcom statement fussball paytv
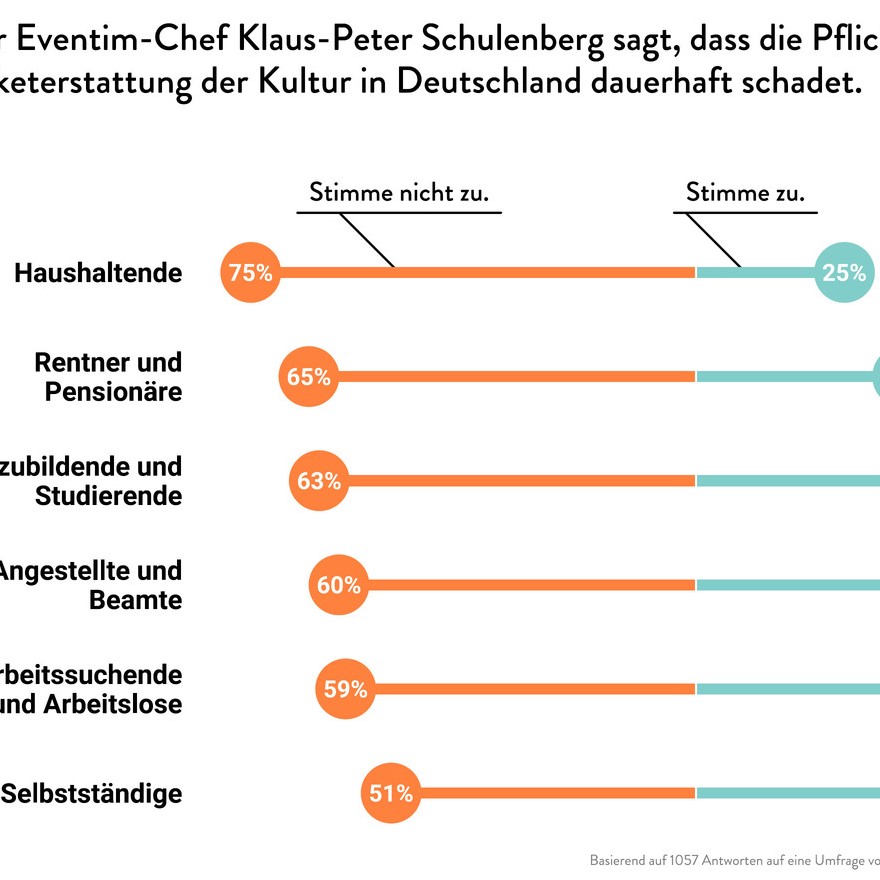
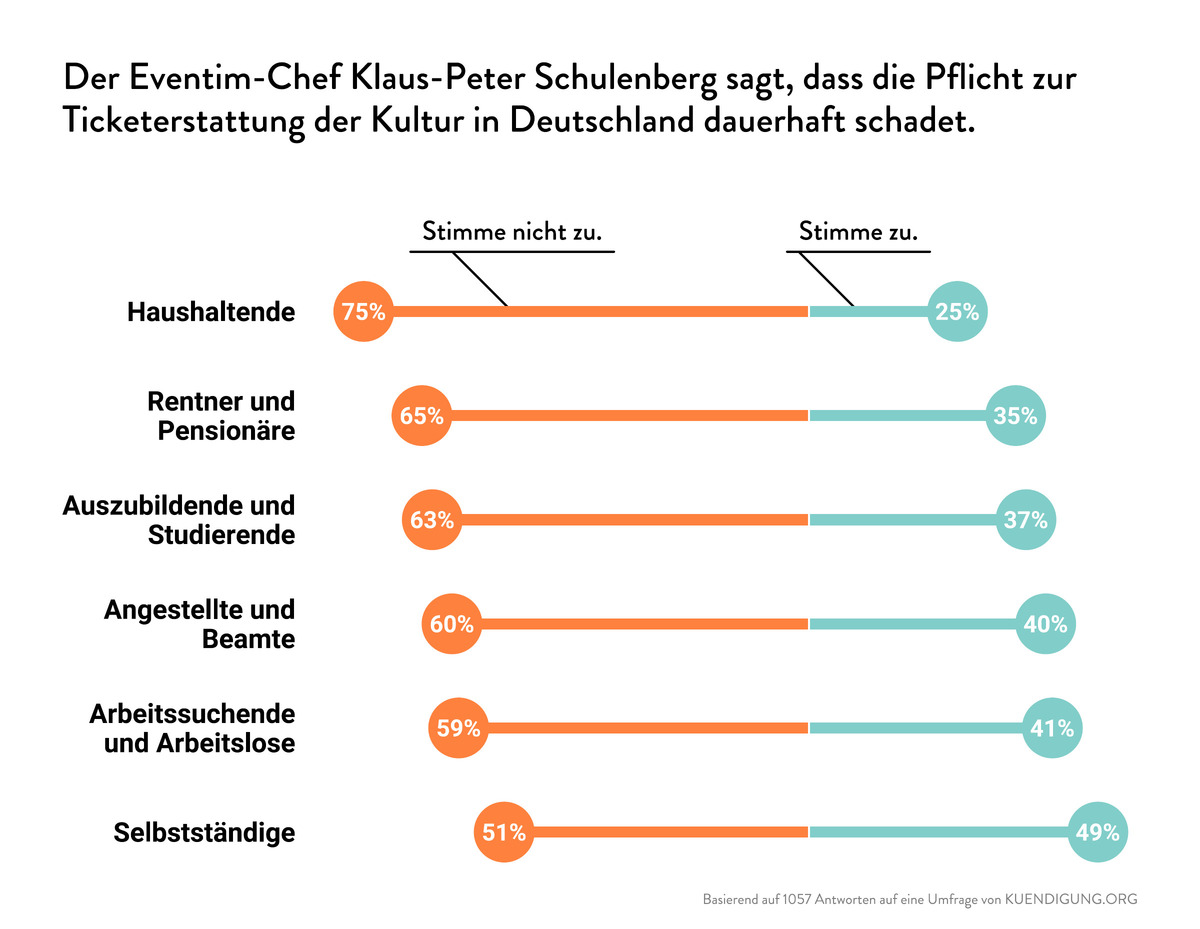
kuendigungcom statement kultur job
Challenge Contributions
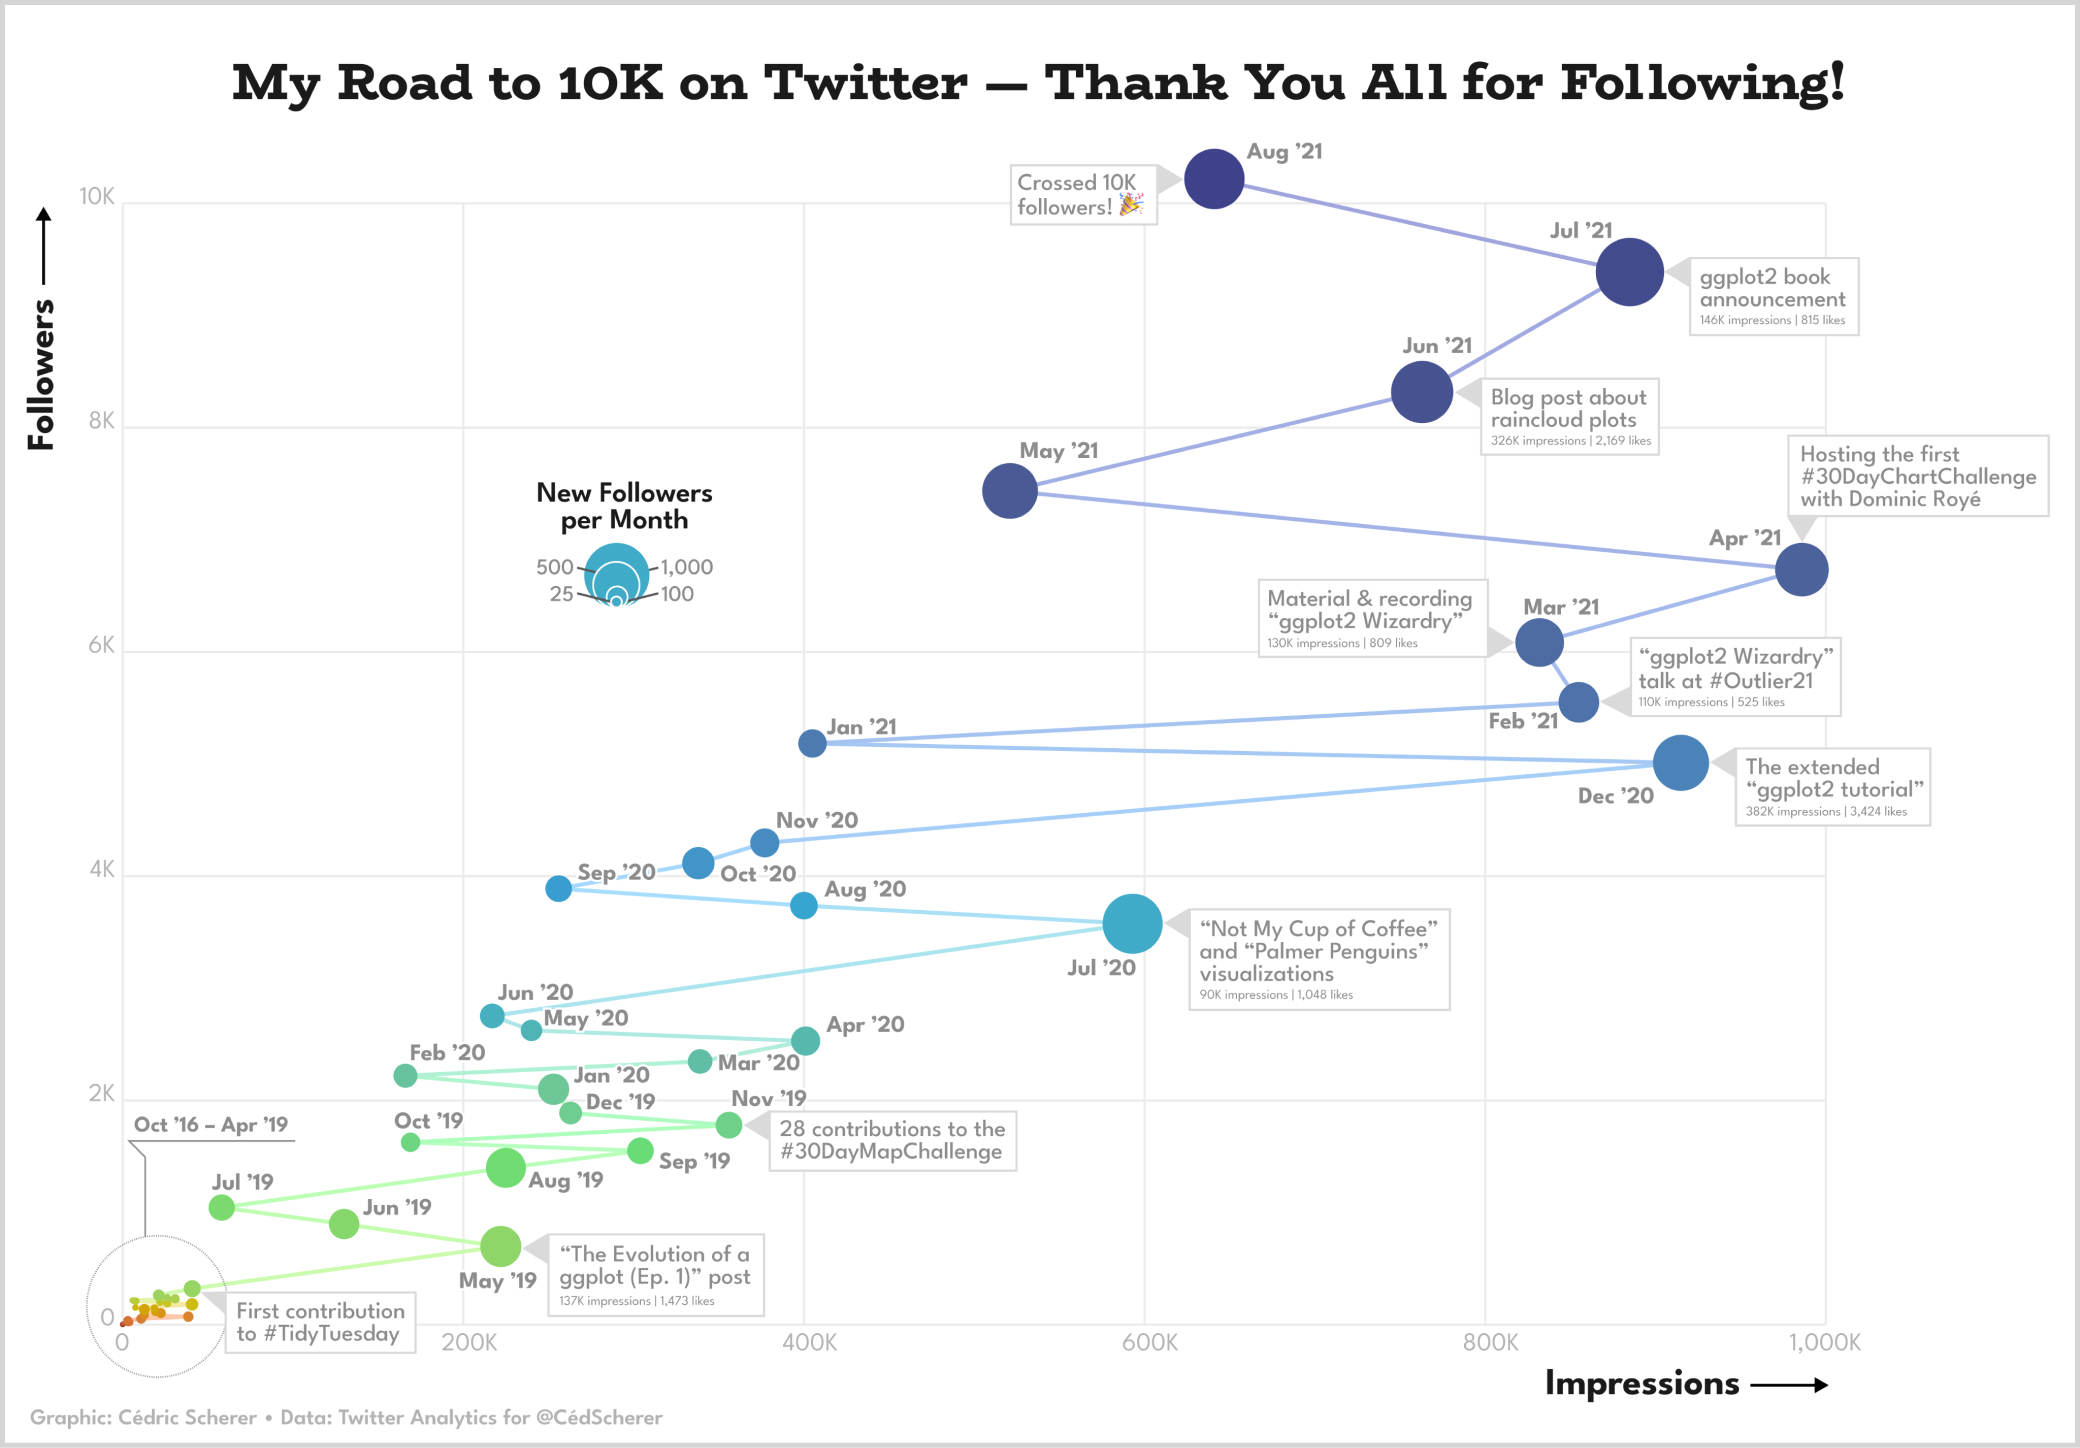
#TidyTuesday
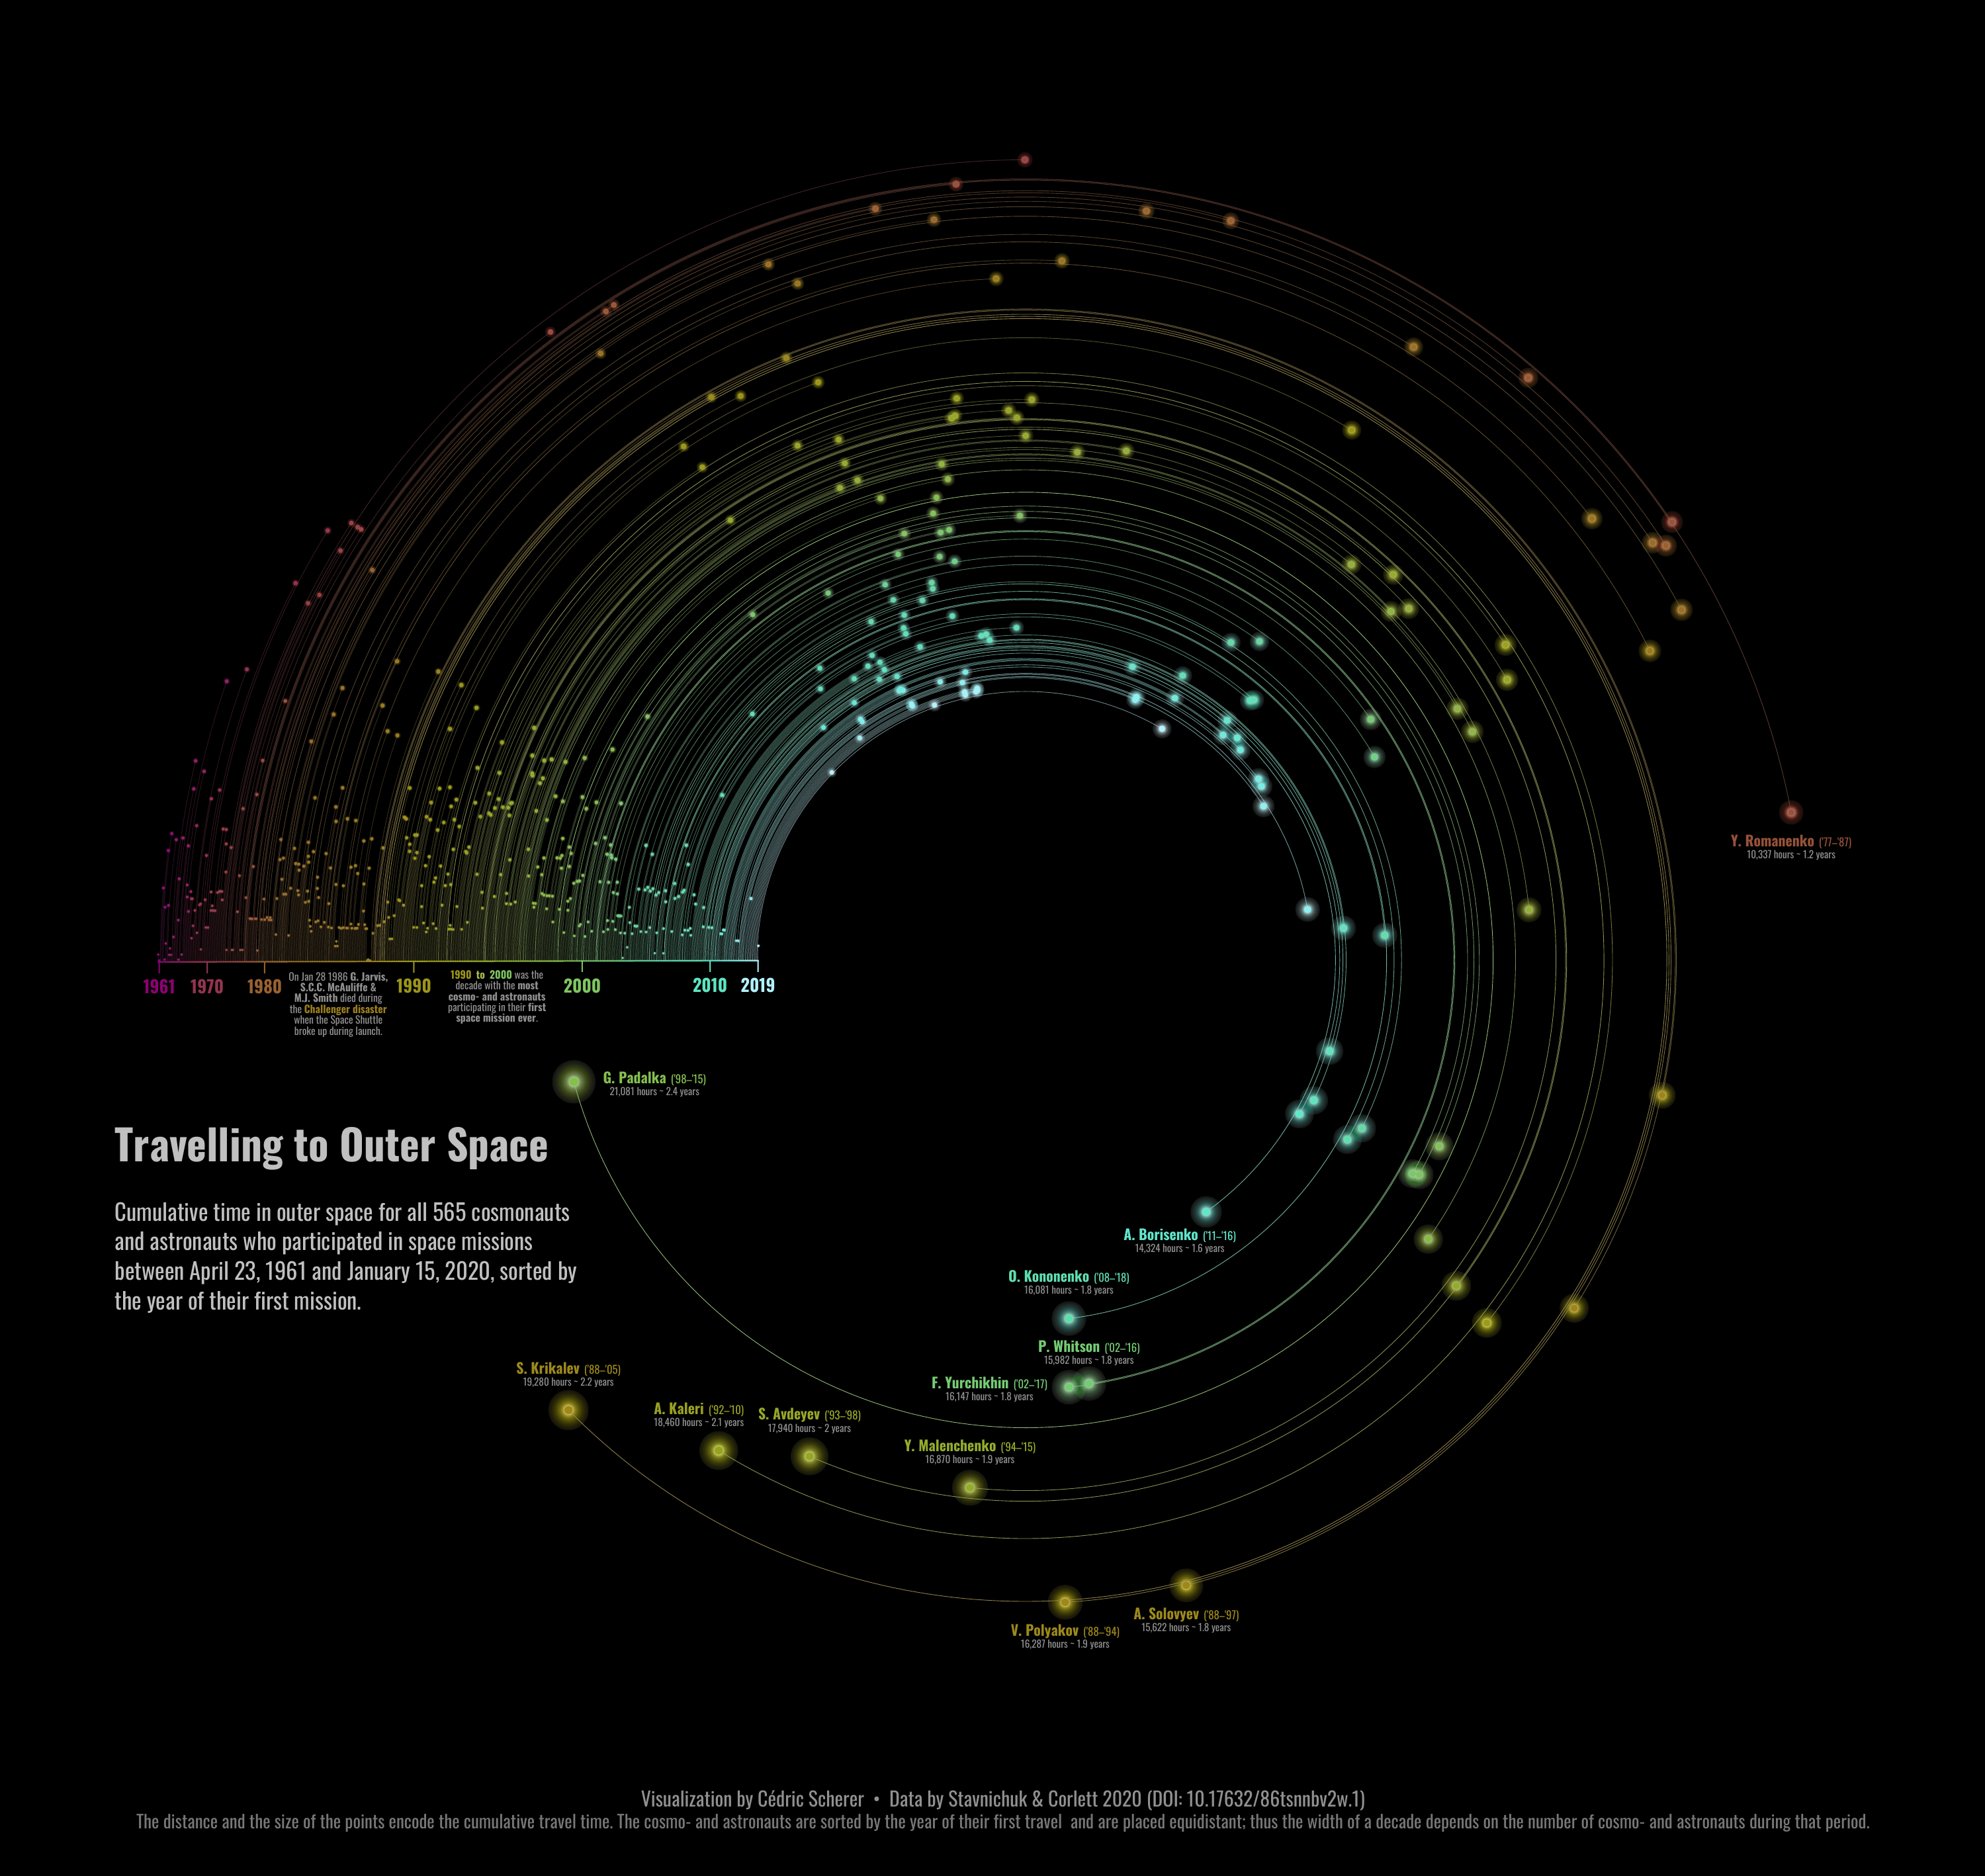
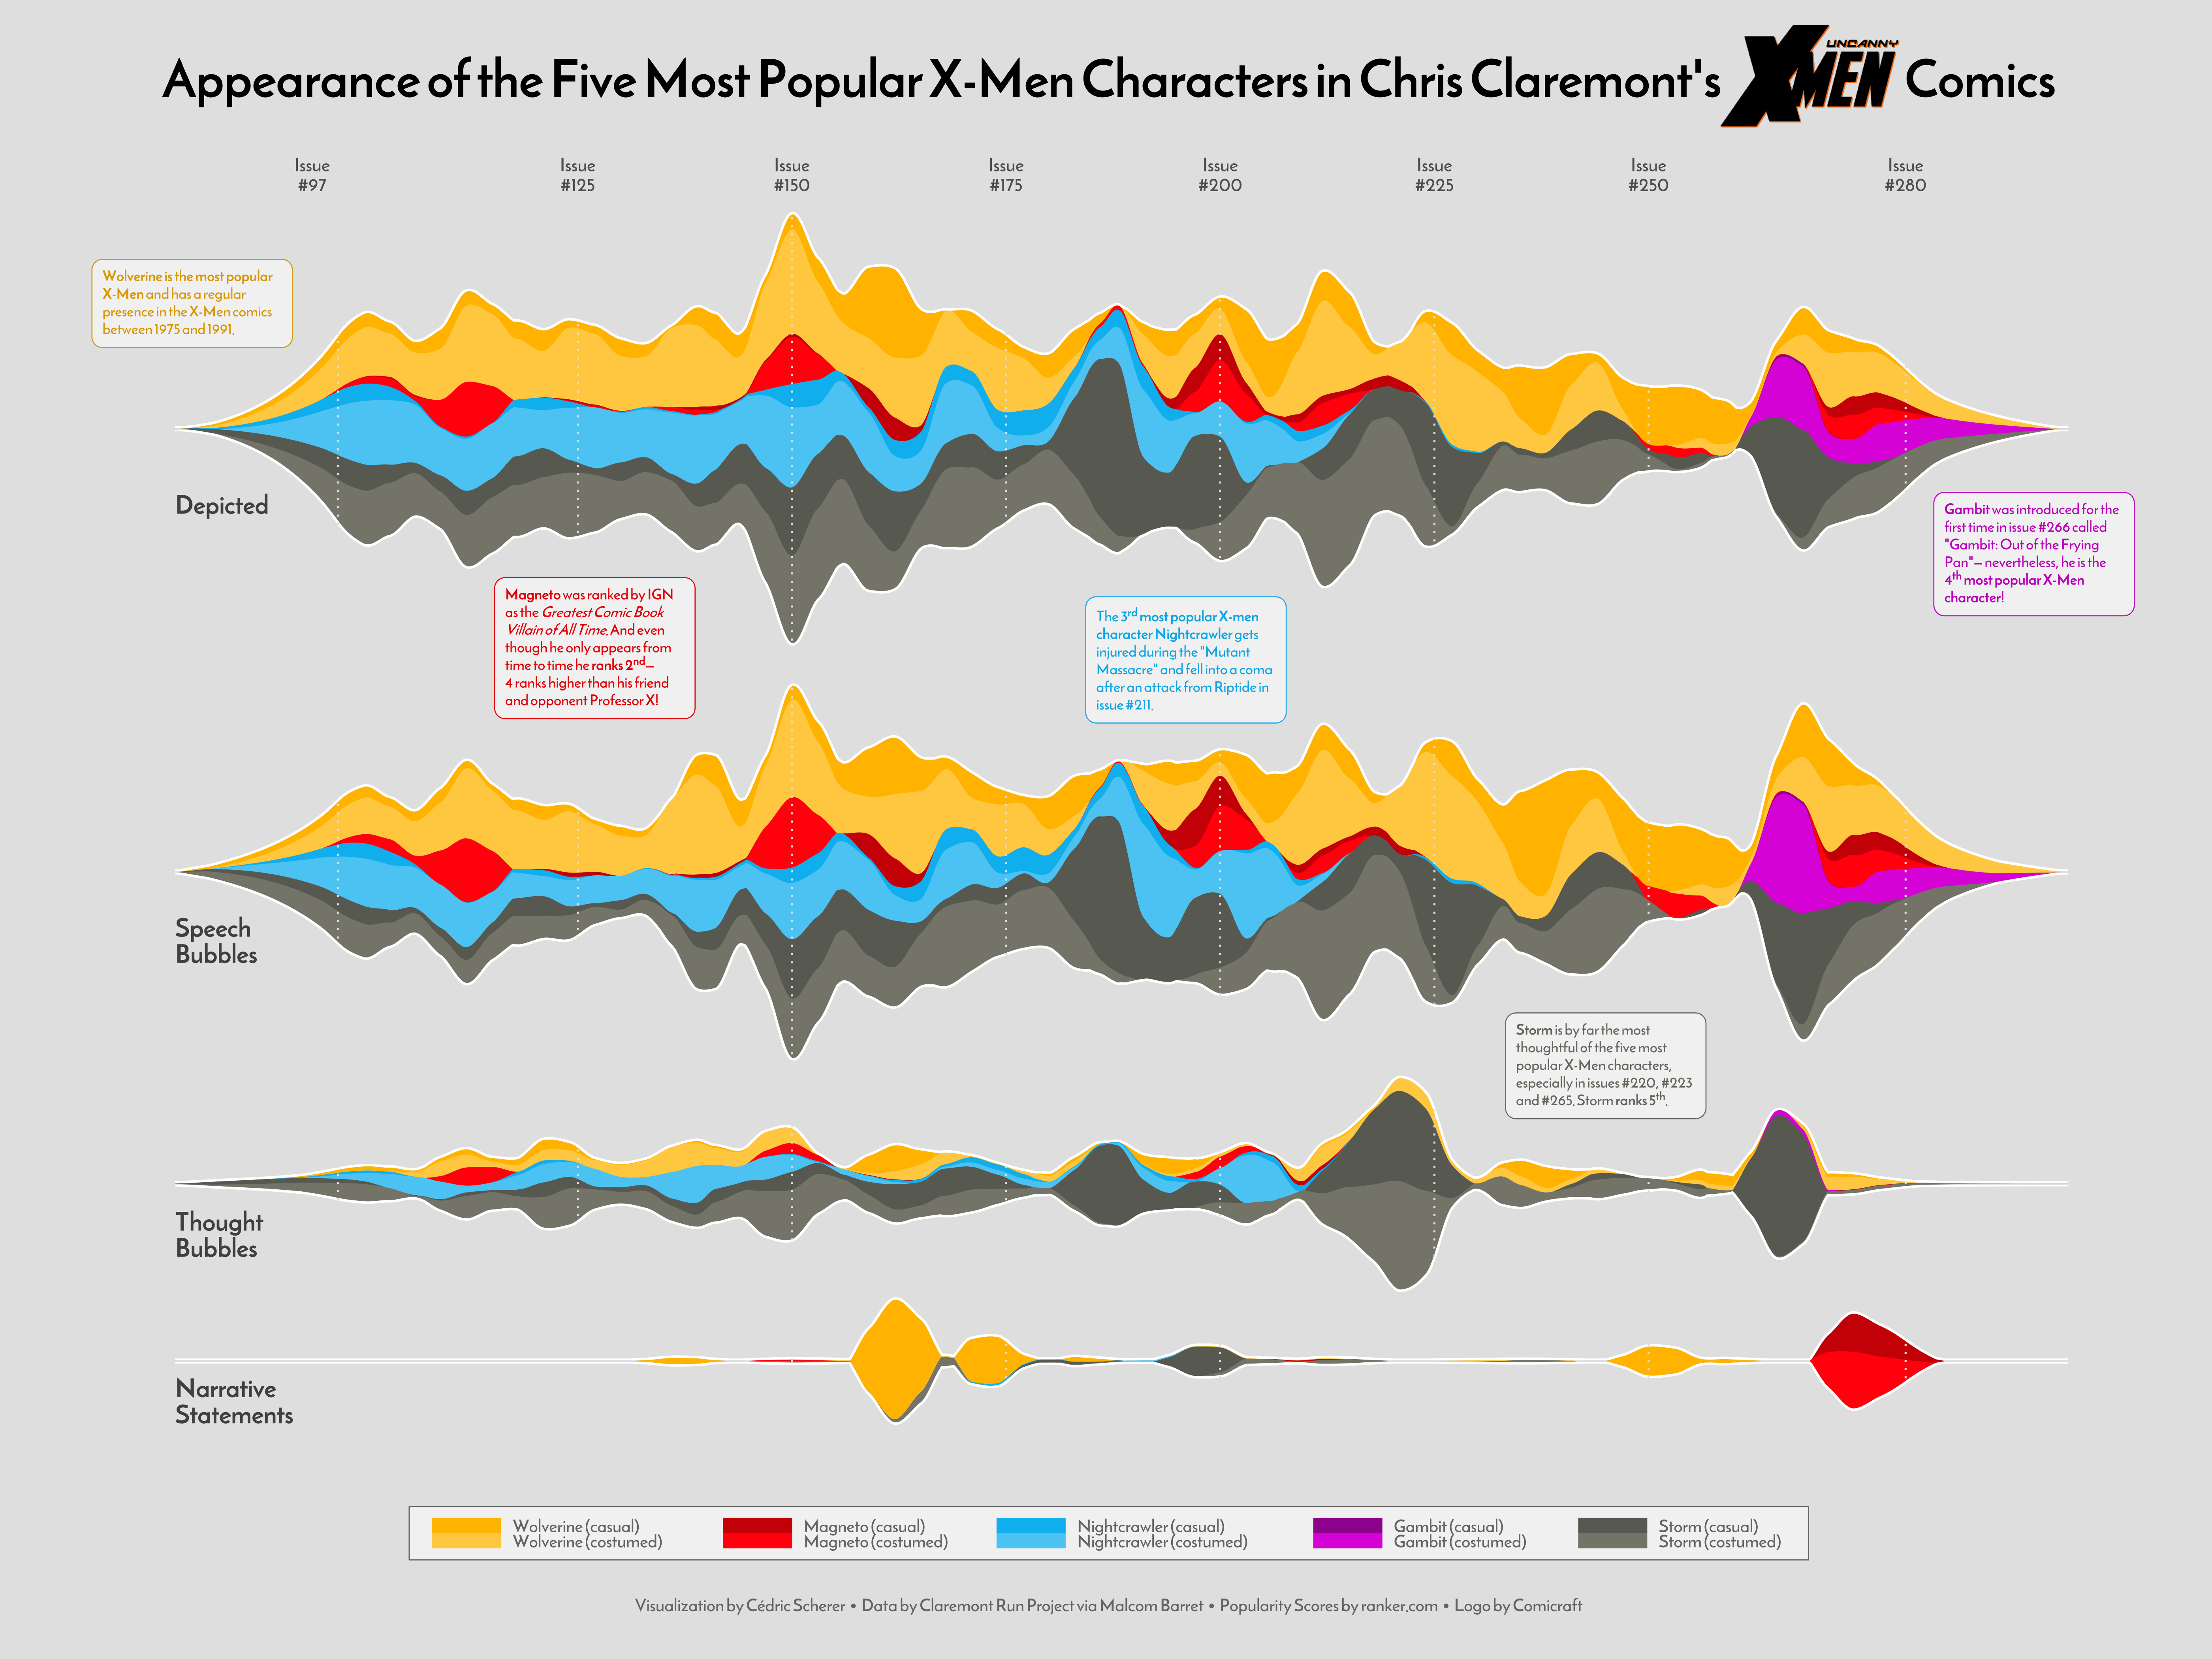
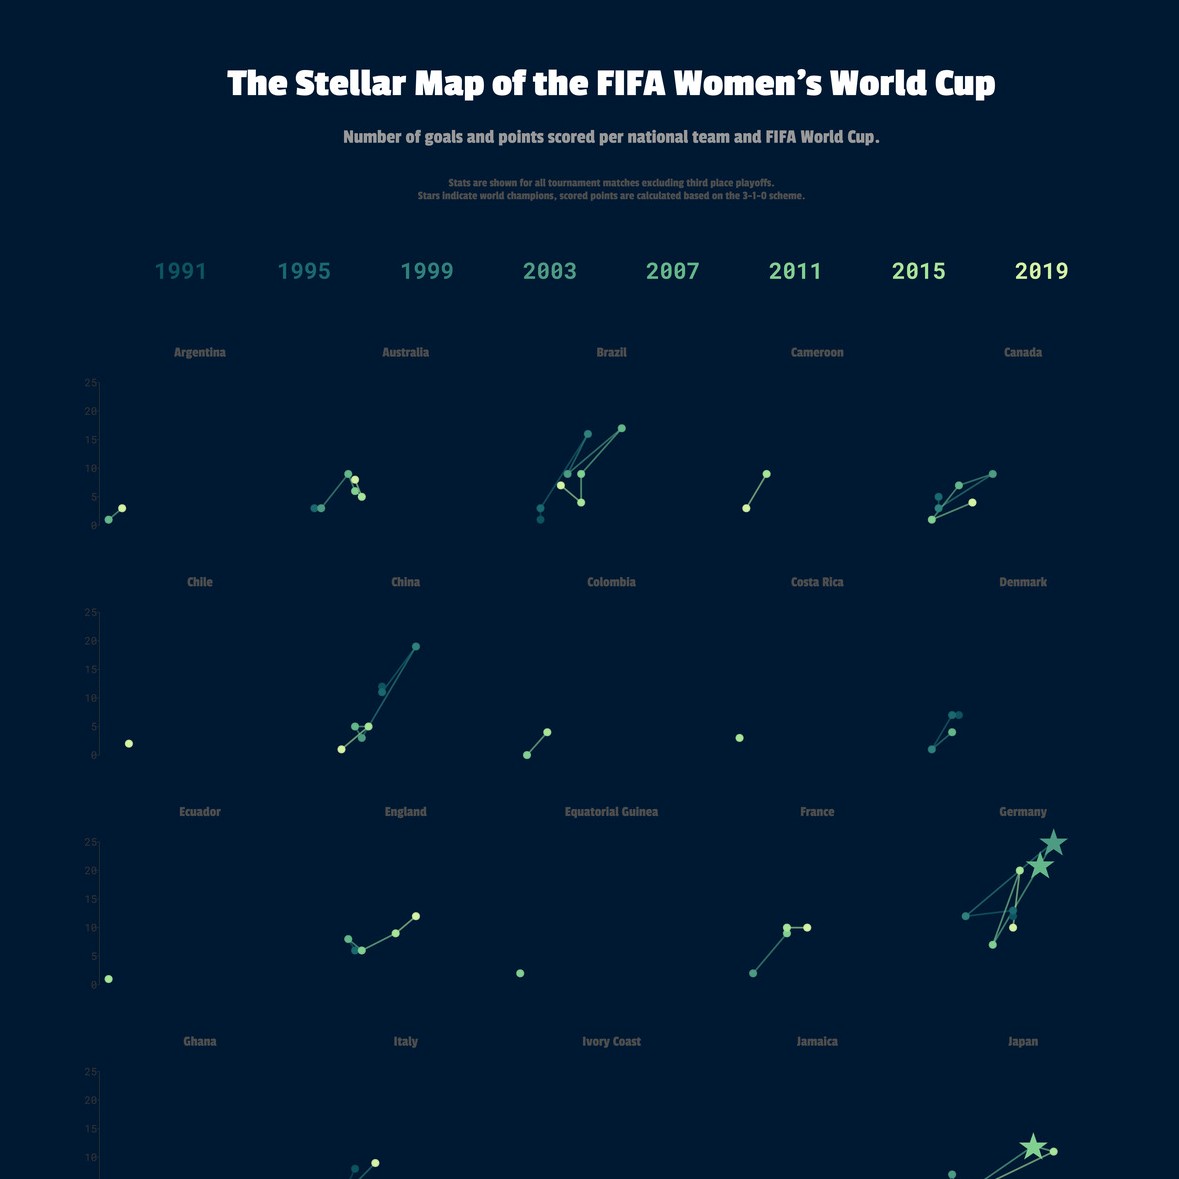
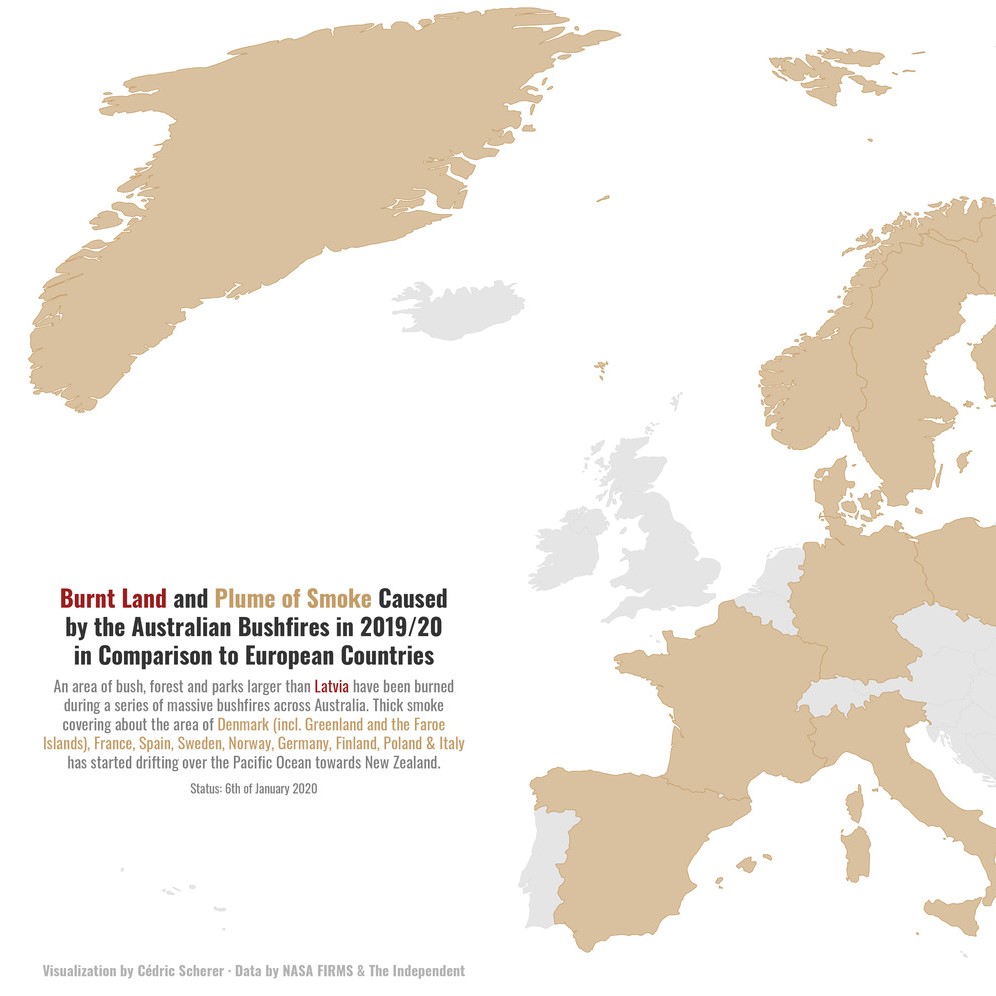
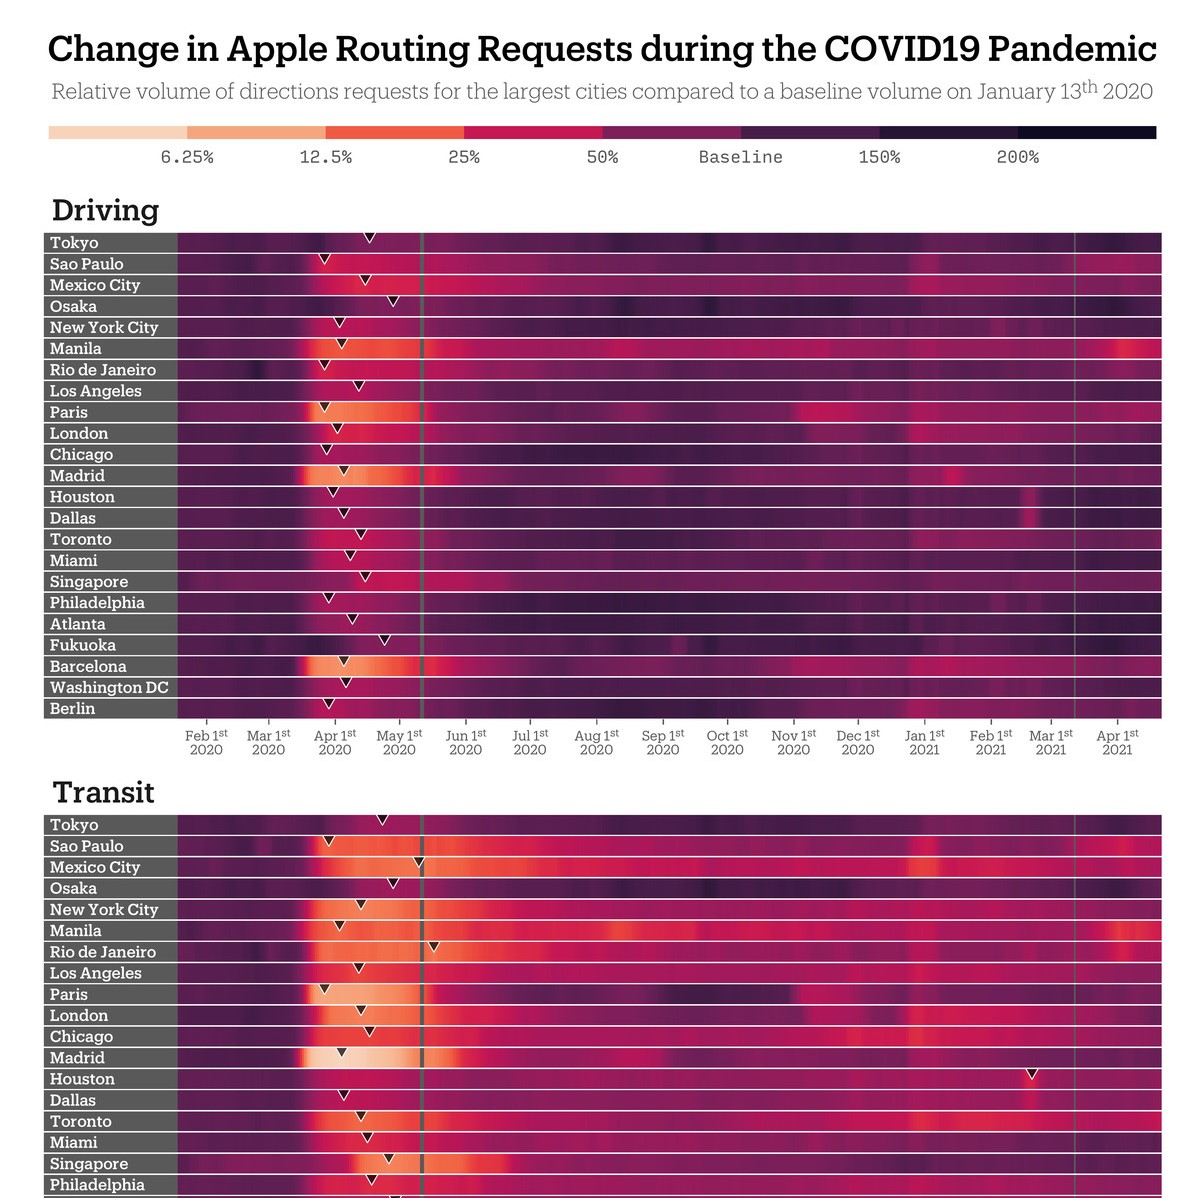
#TidyTuesday is a weekly data project aimed at the R ecosystem and the {tidyverse} package bundle to wrangle, explore and visualize the data set that is provided by the R4DS Online Learning Community. All visualizations are produced with 100% code using the {ggplot2} graphics library in R and without any post-processing.
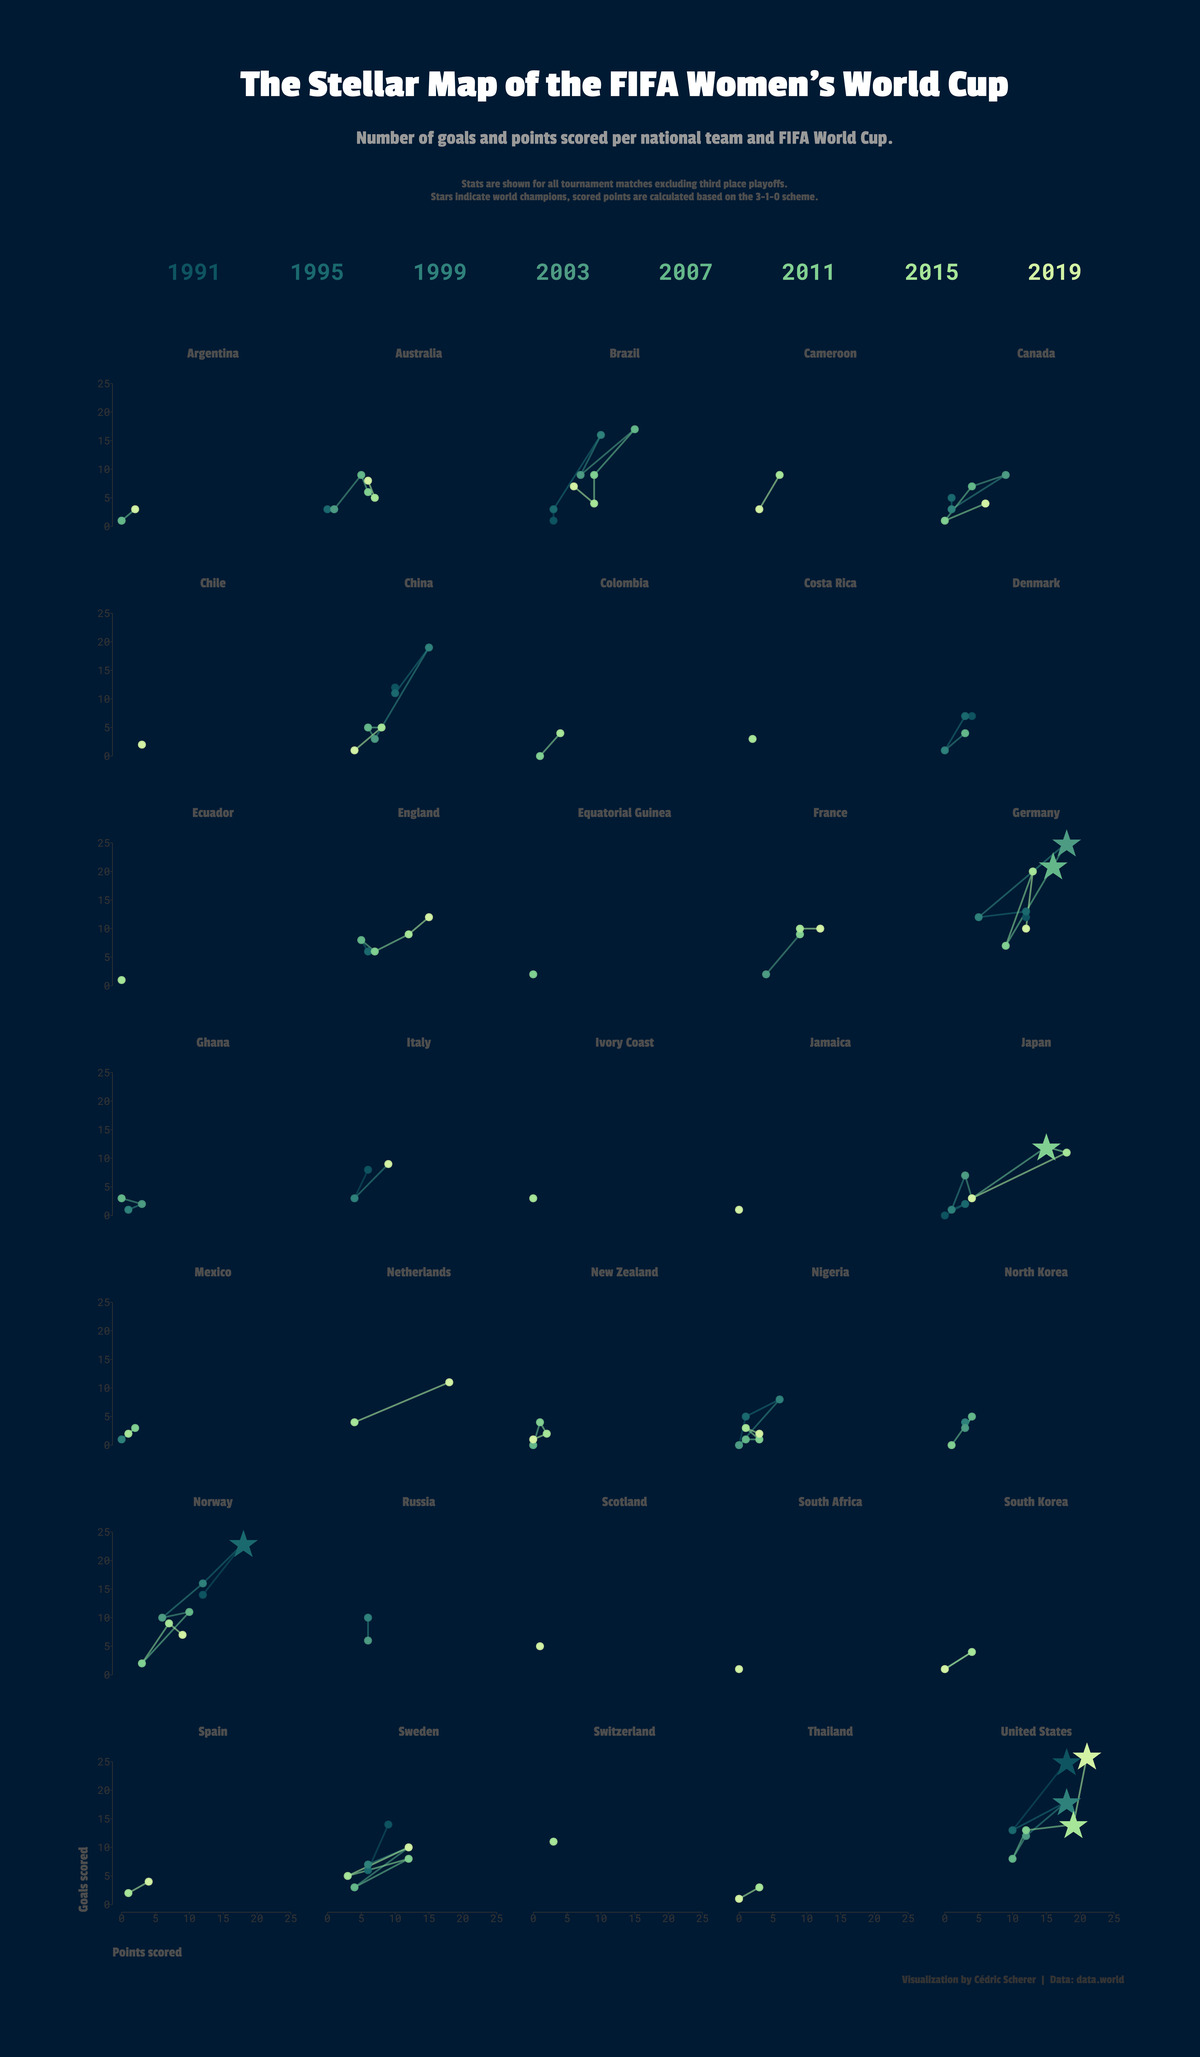
TidyTuesday Week 2019 28 FIFA Womens World Cup Stellar Map
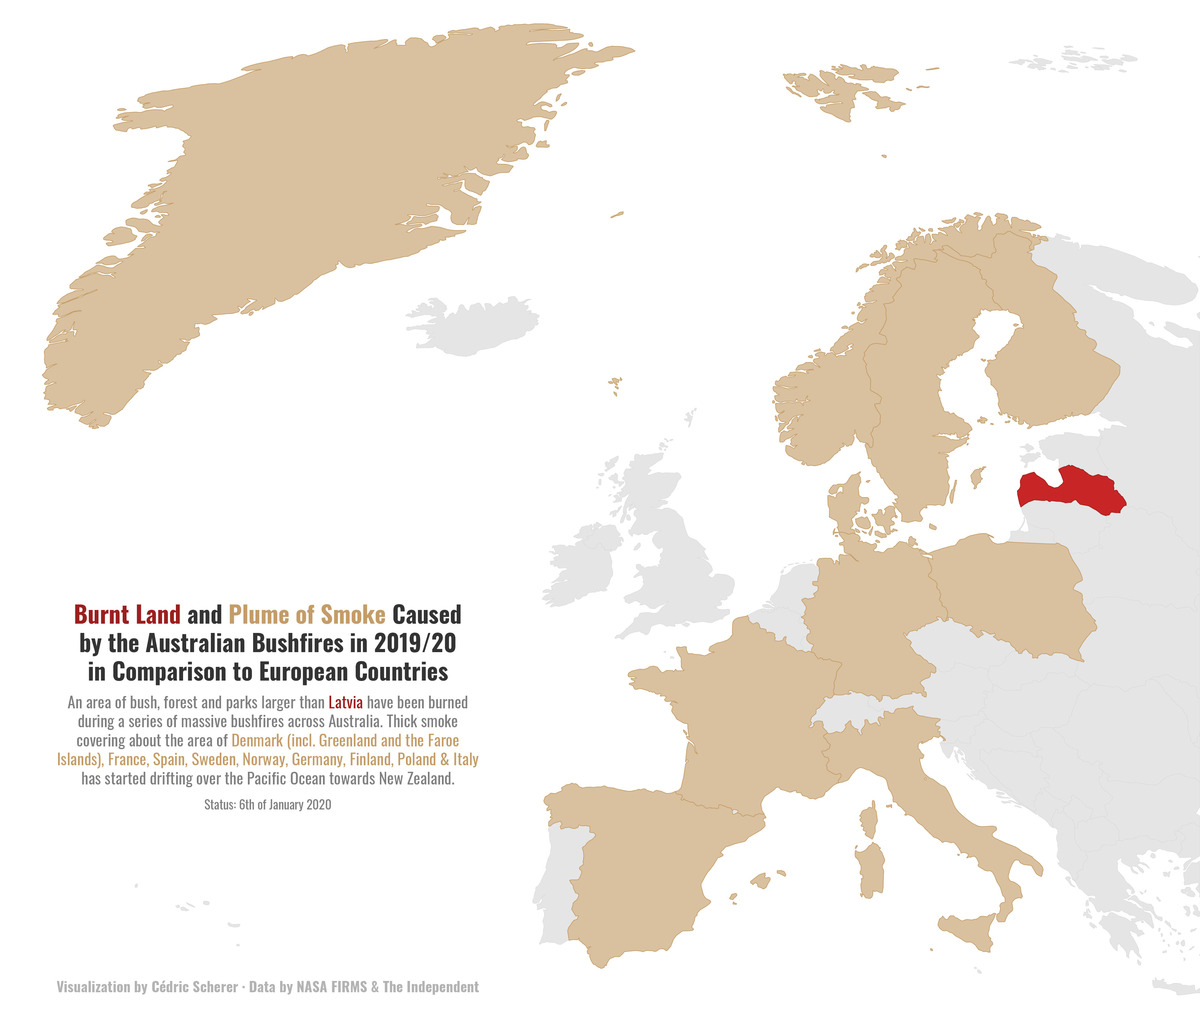
TidyTuesday Week 2020 02 Australian Fires
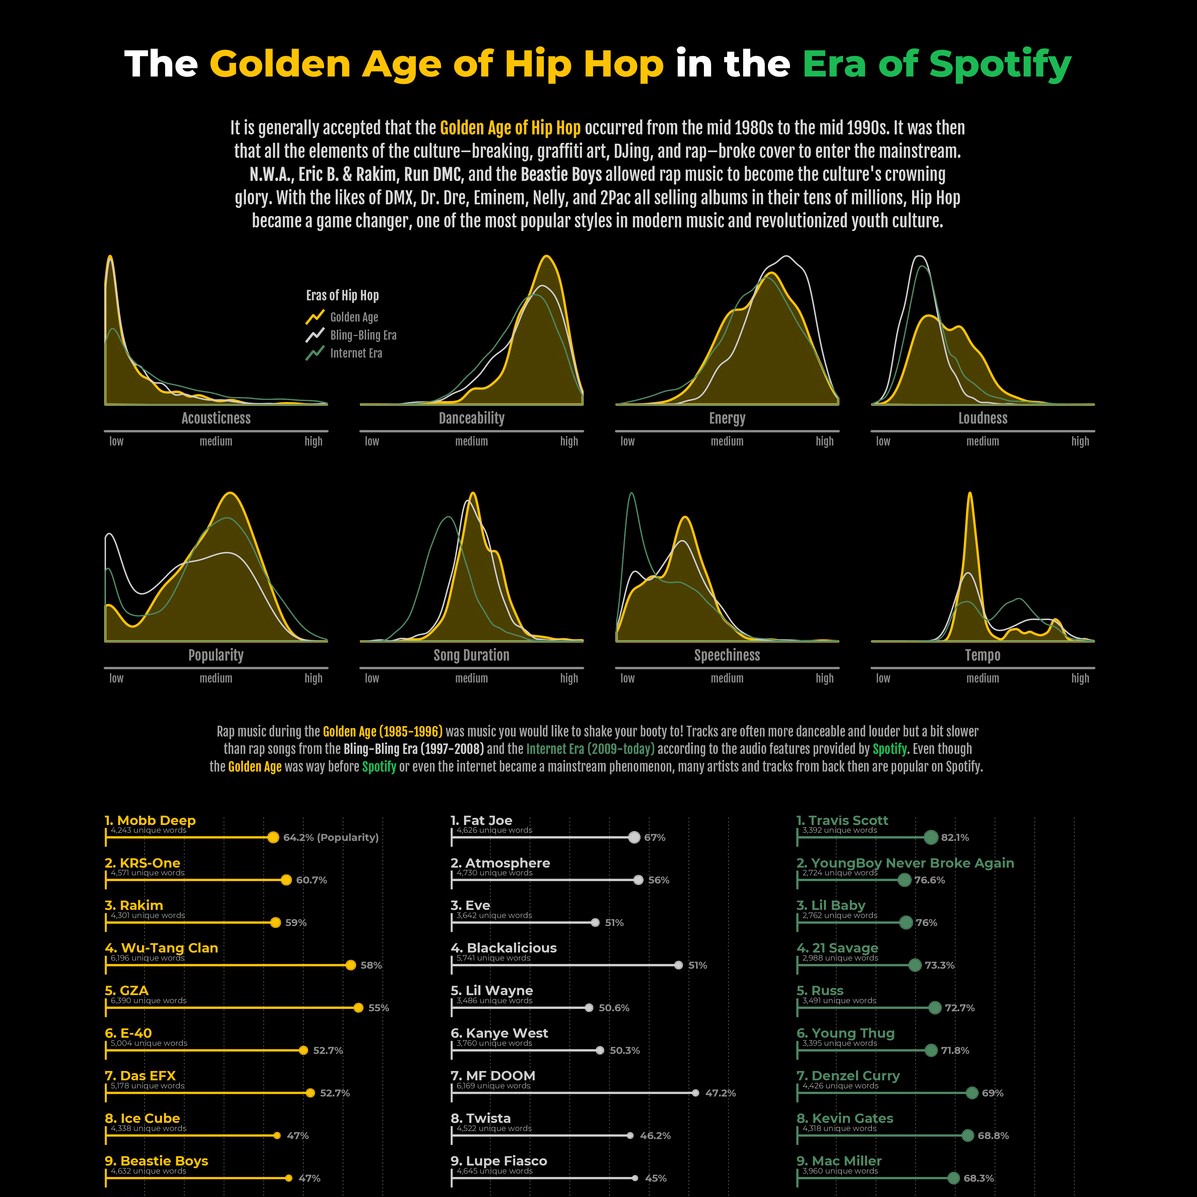
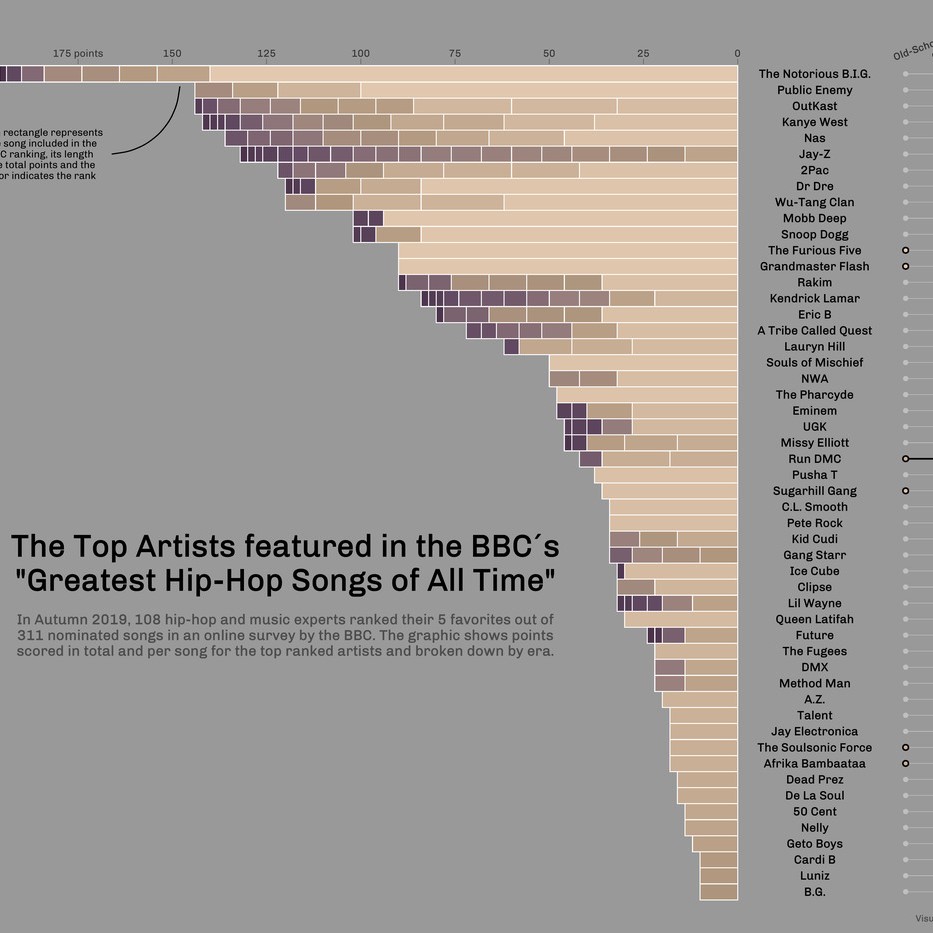
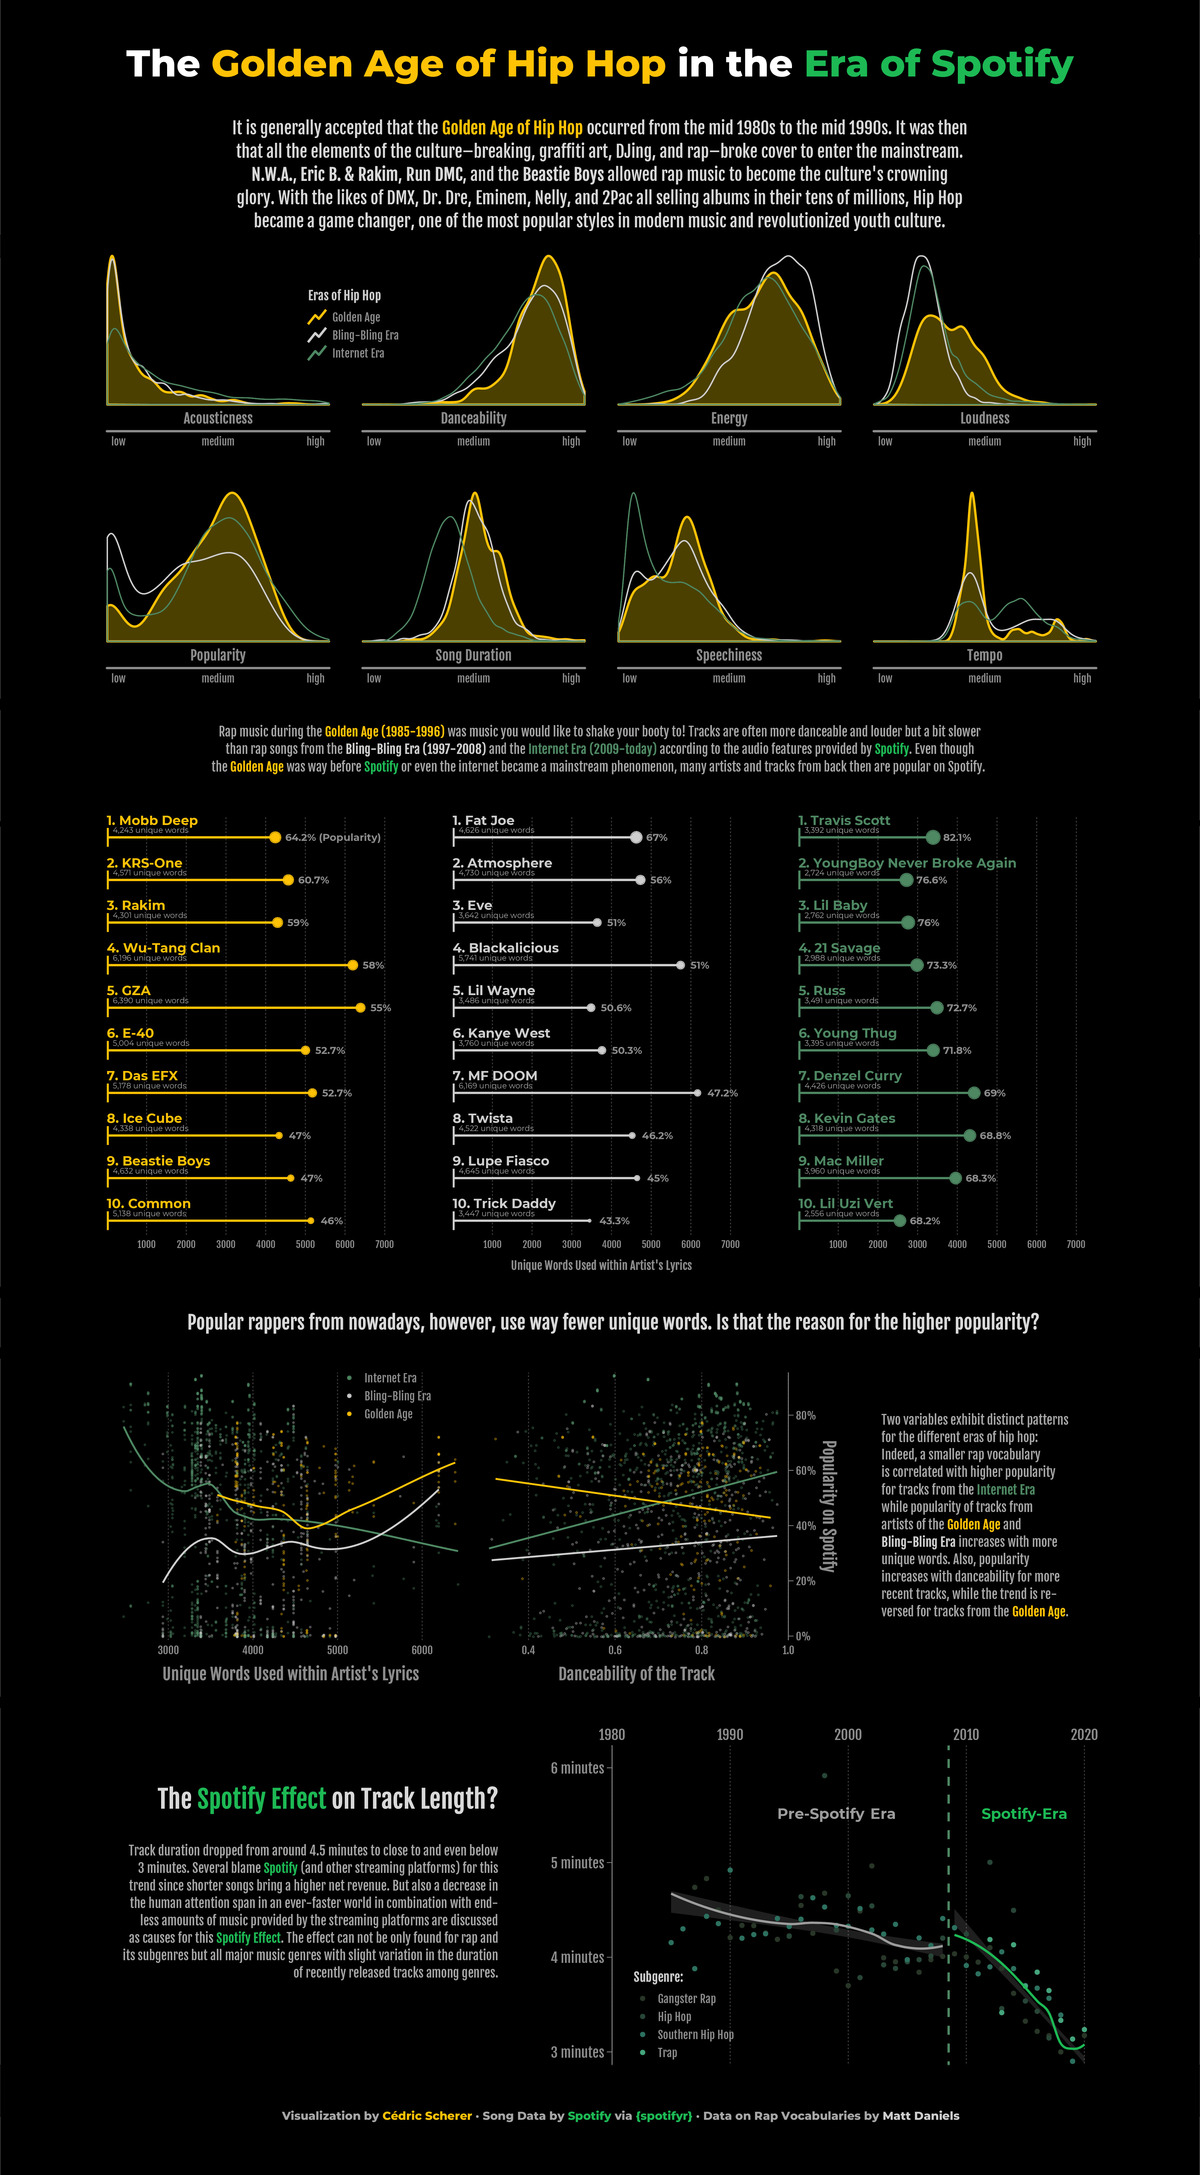
TidyTuesday Week 2020 04 Spotify Songs Golden Age of HipHop
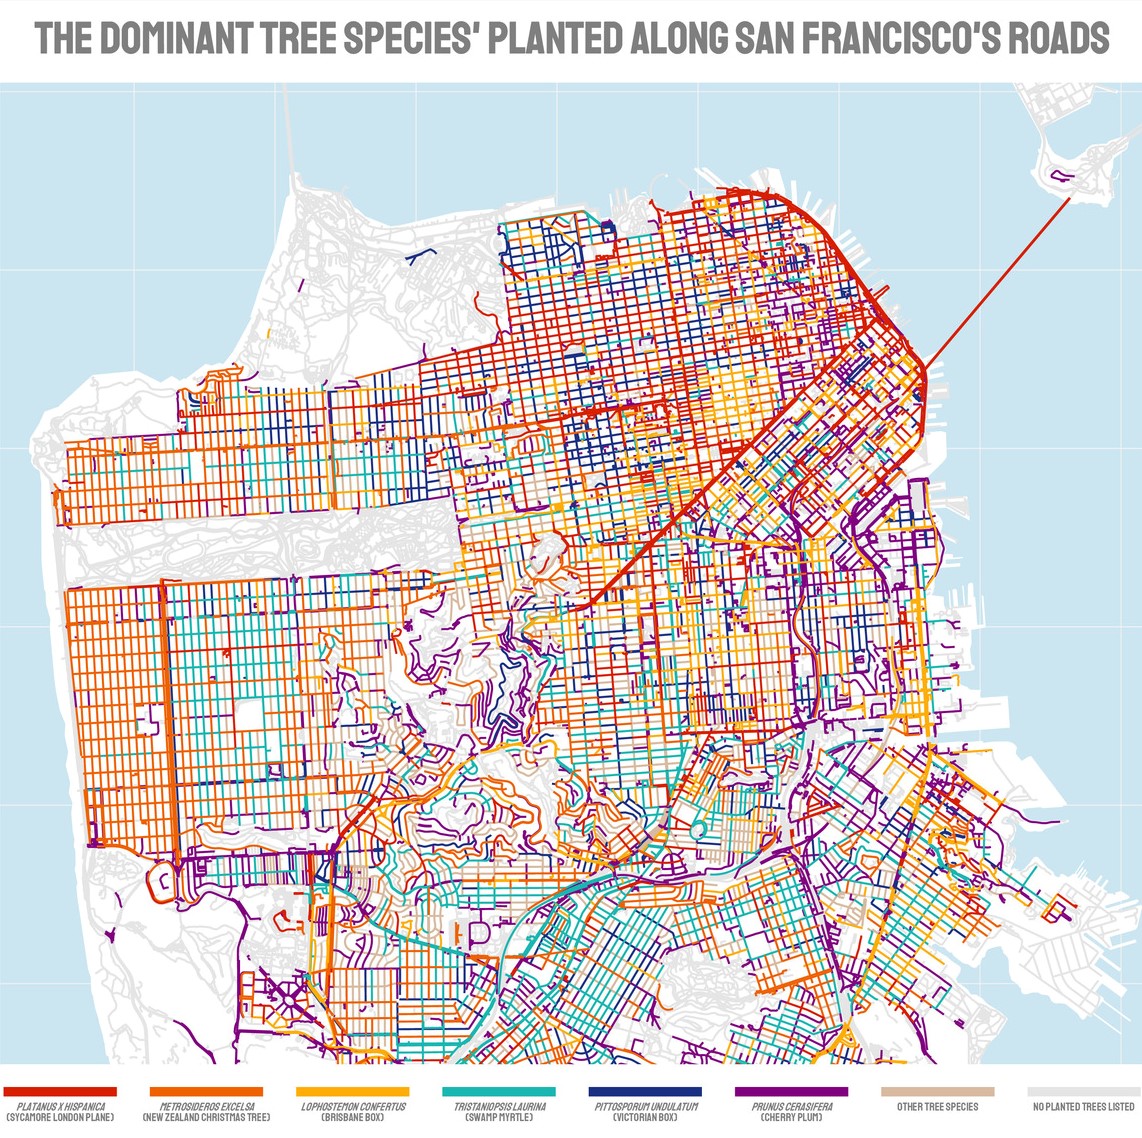
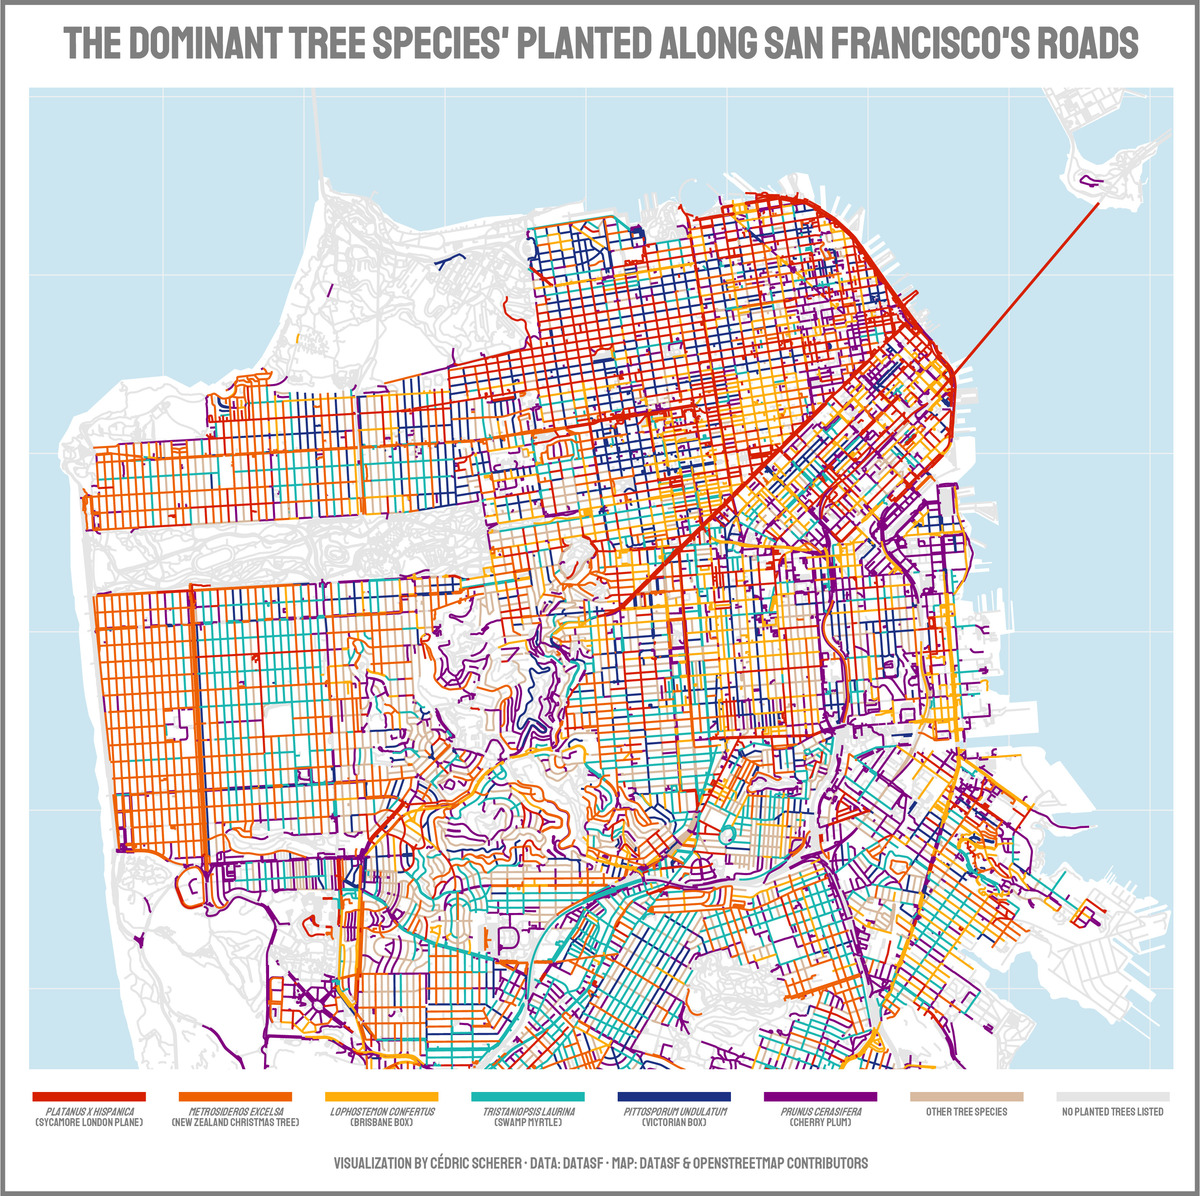
TidyTuesday Week 2020 05 Trees in San Francisco
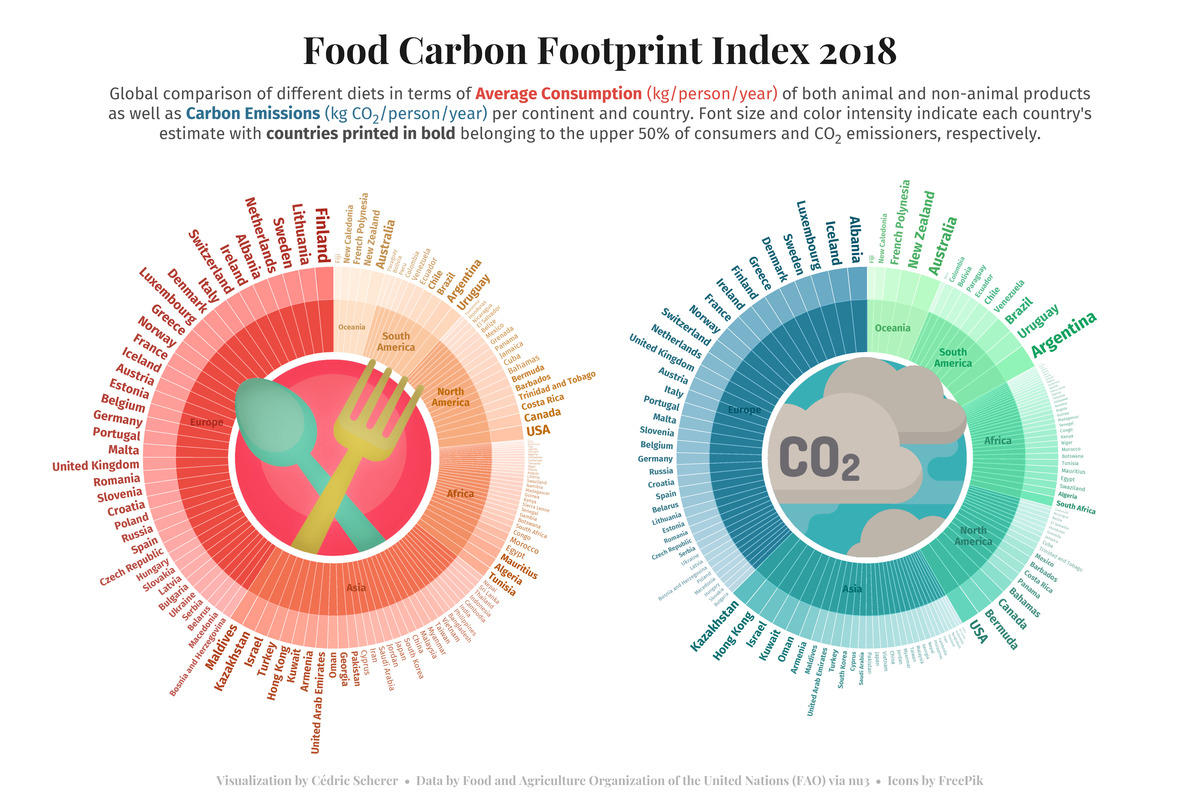
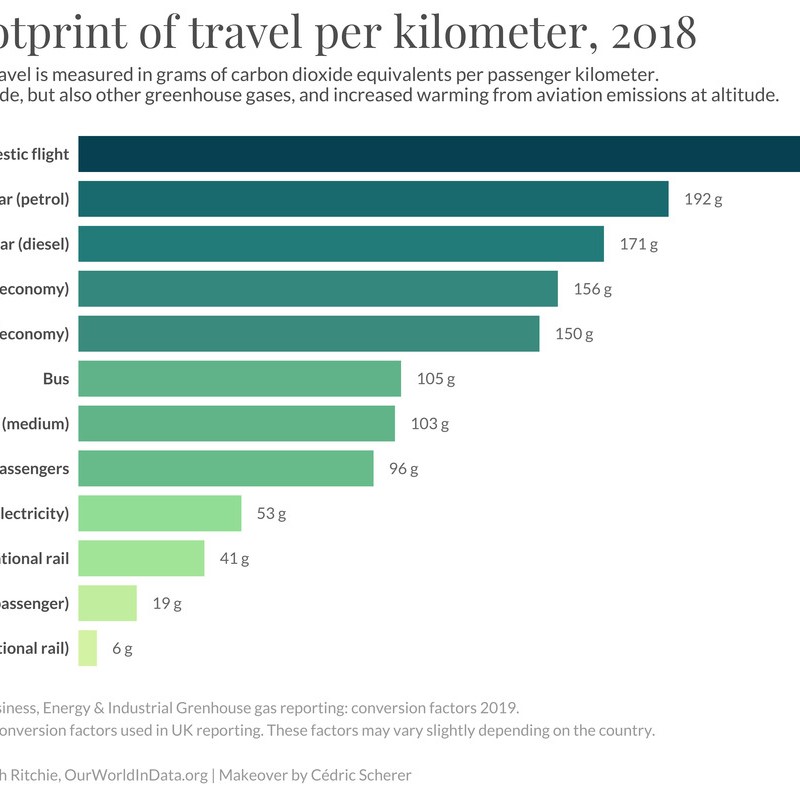
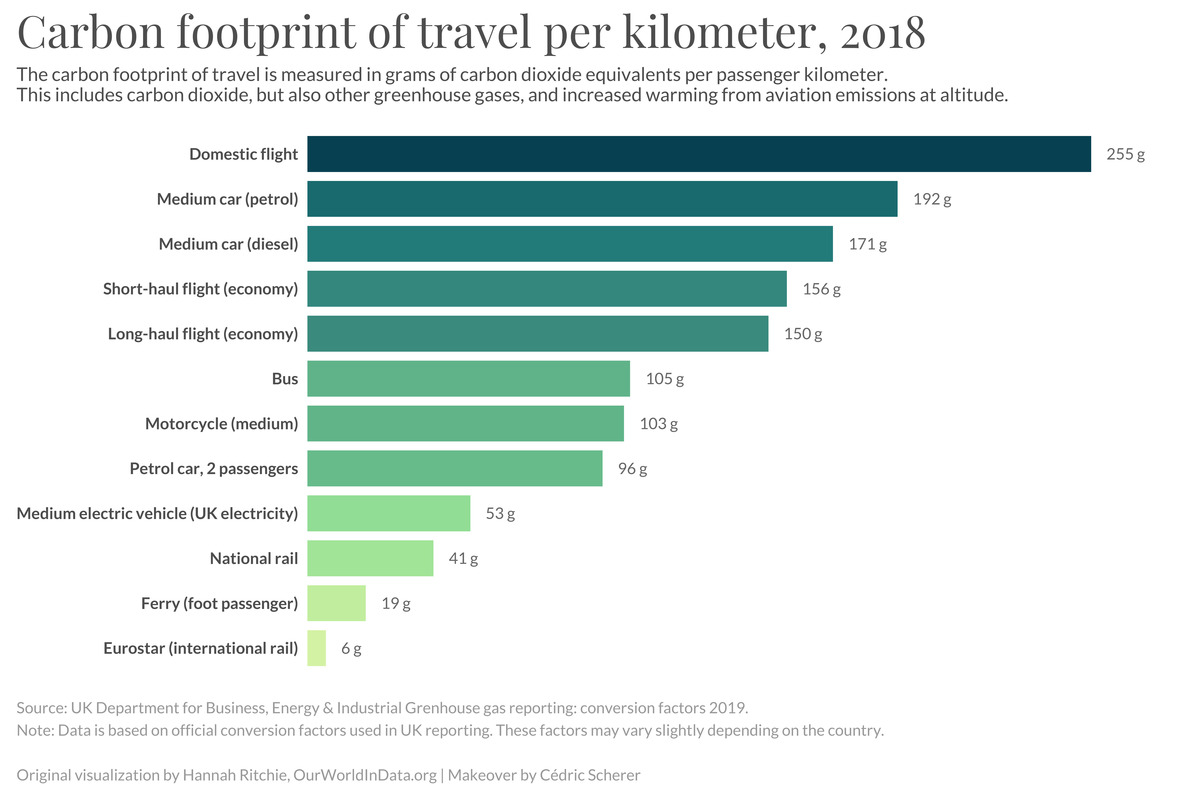
TidyTuesday Week 2020 08 Carbon Footprint Index 2018
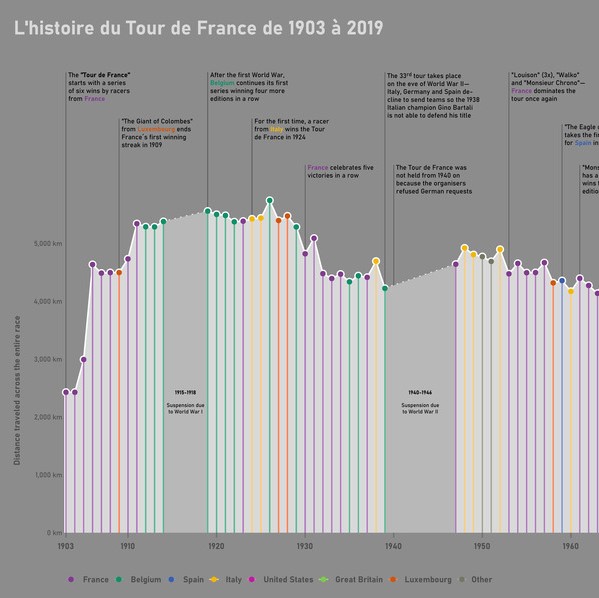
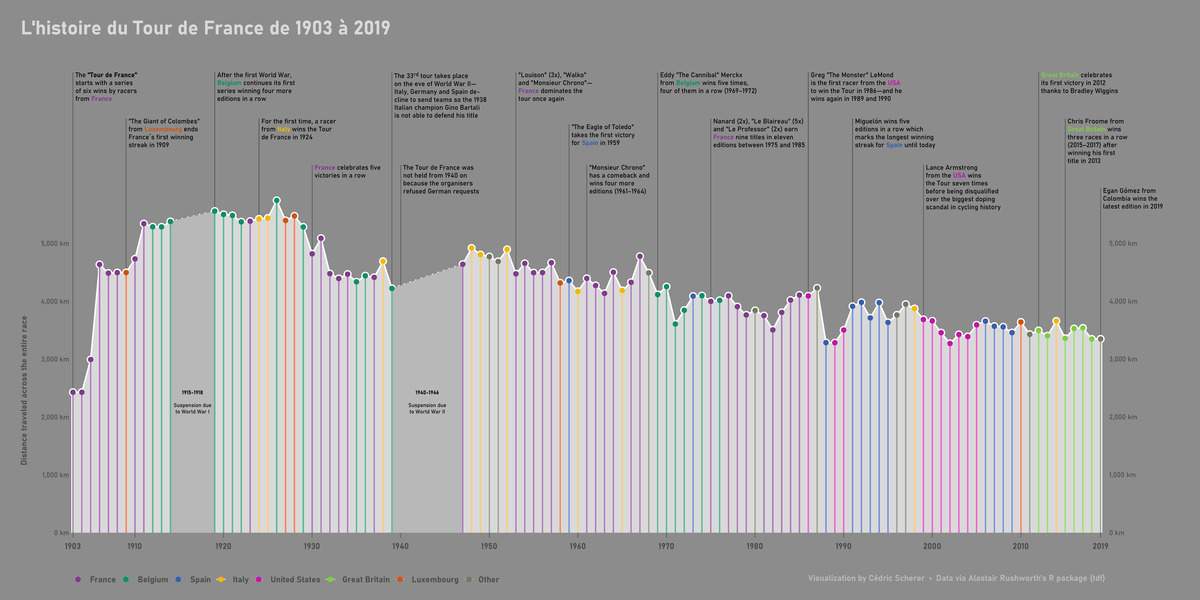
TidyTuesday Week 2020 15 Tour De France History
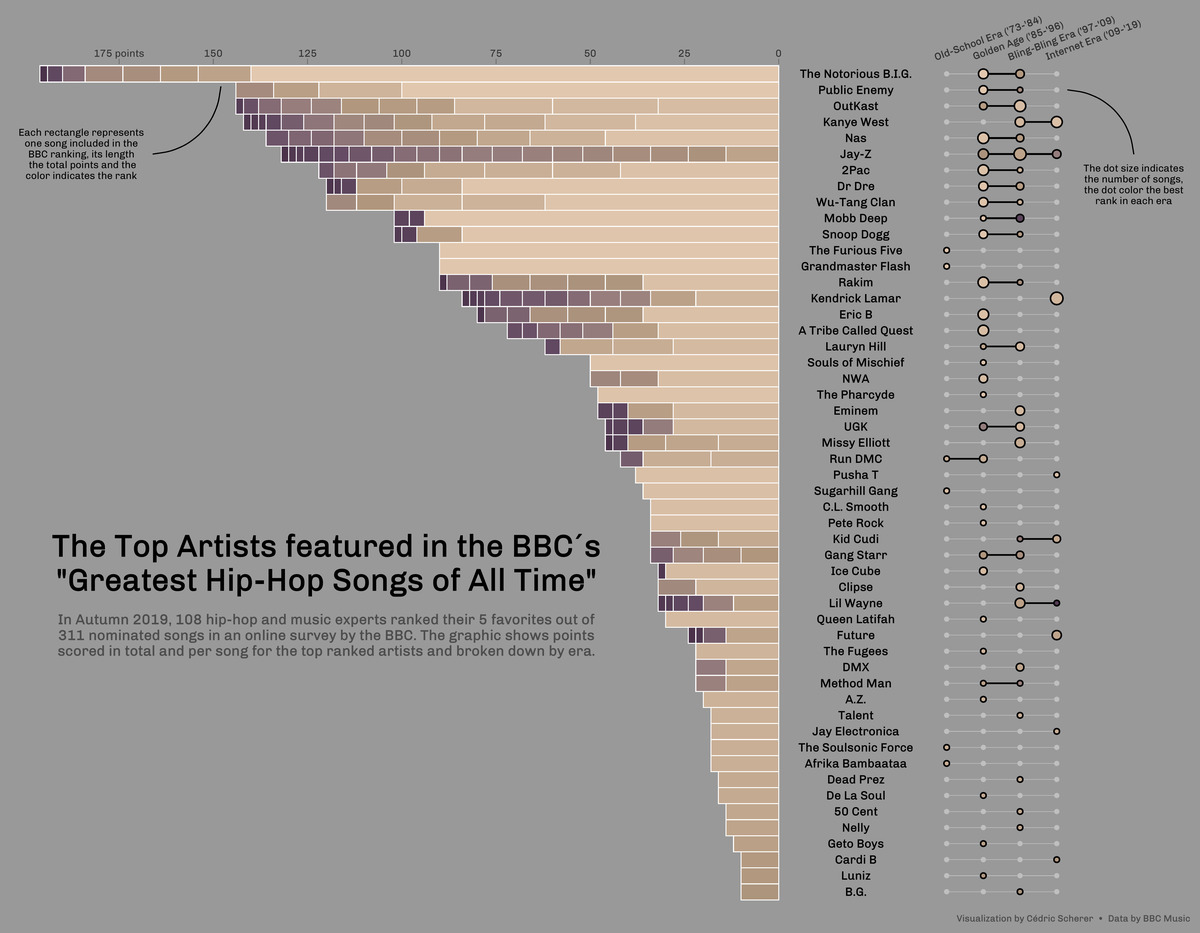
TidyTuesday Week 2020 16 Best Rap Artists
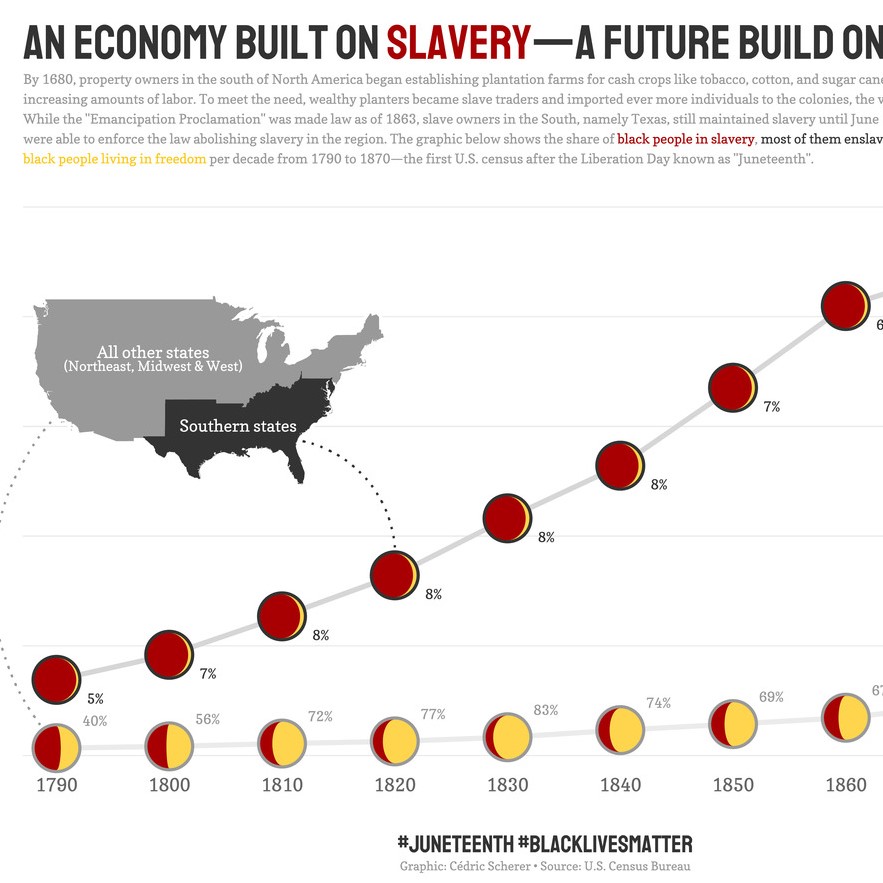
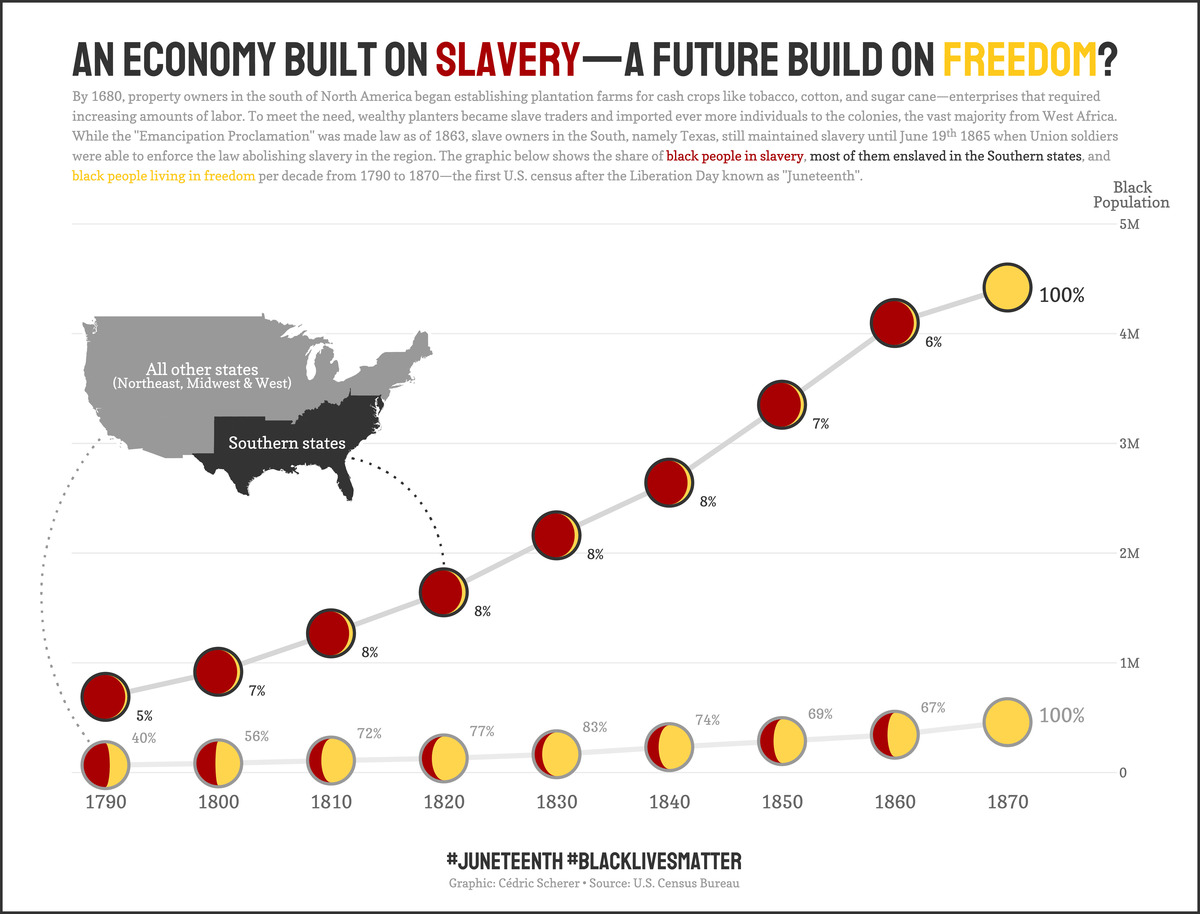
TidyTuesday Week 2020 25 American Slavery History for Juneteenth
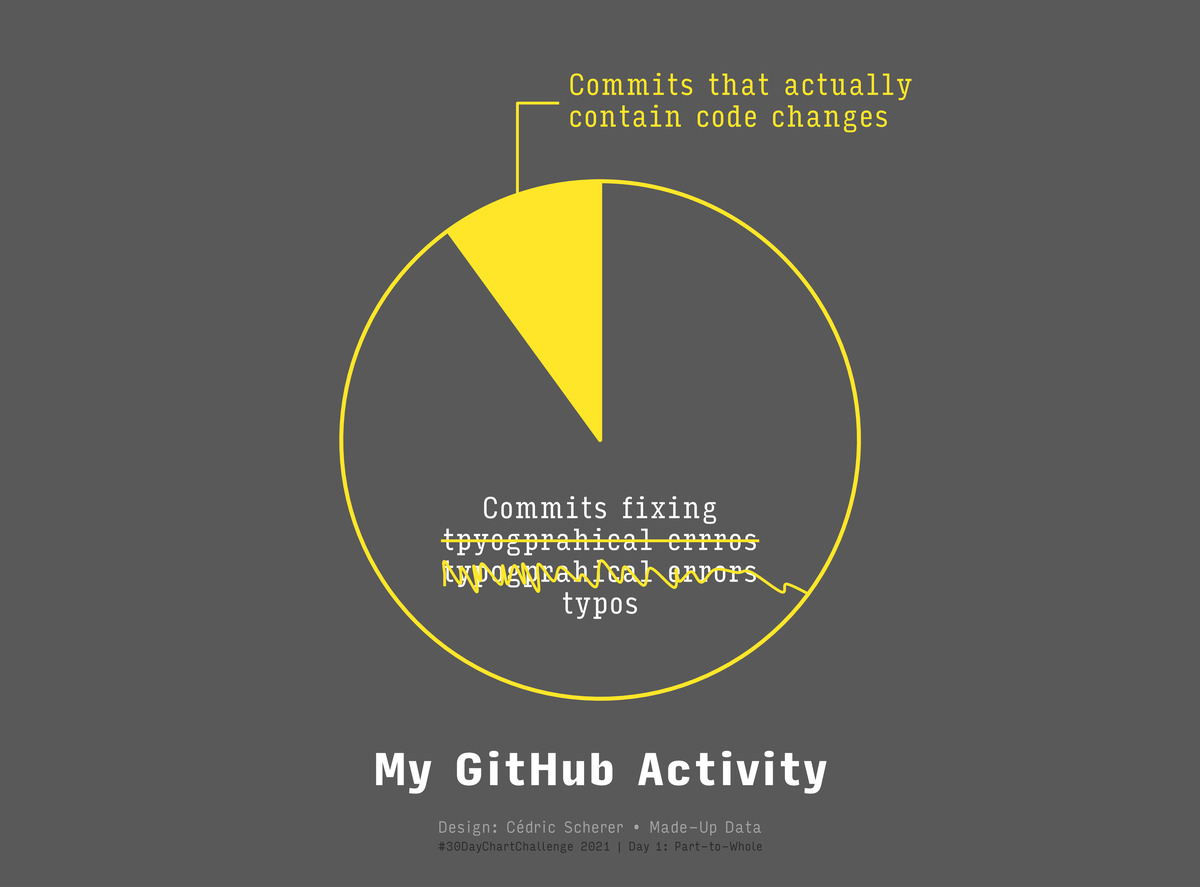
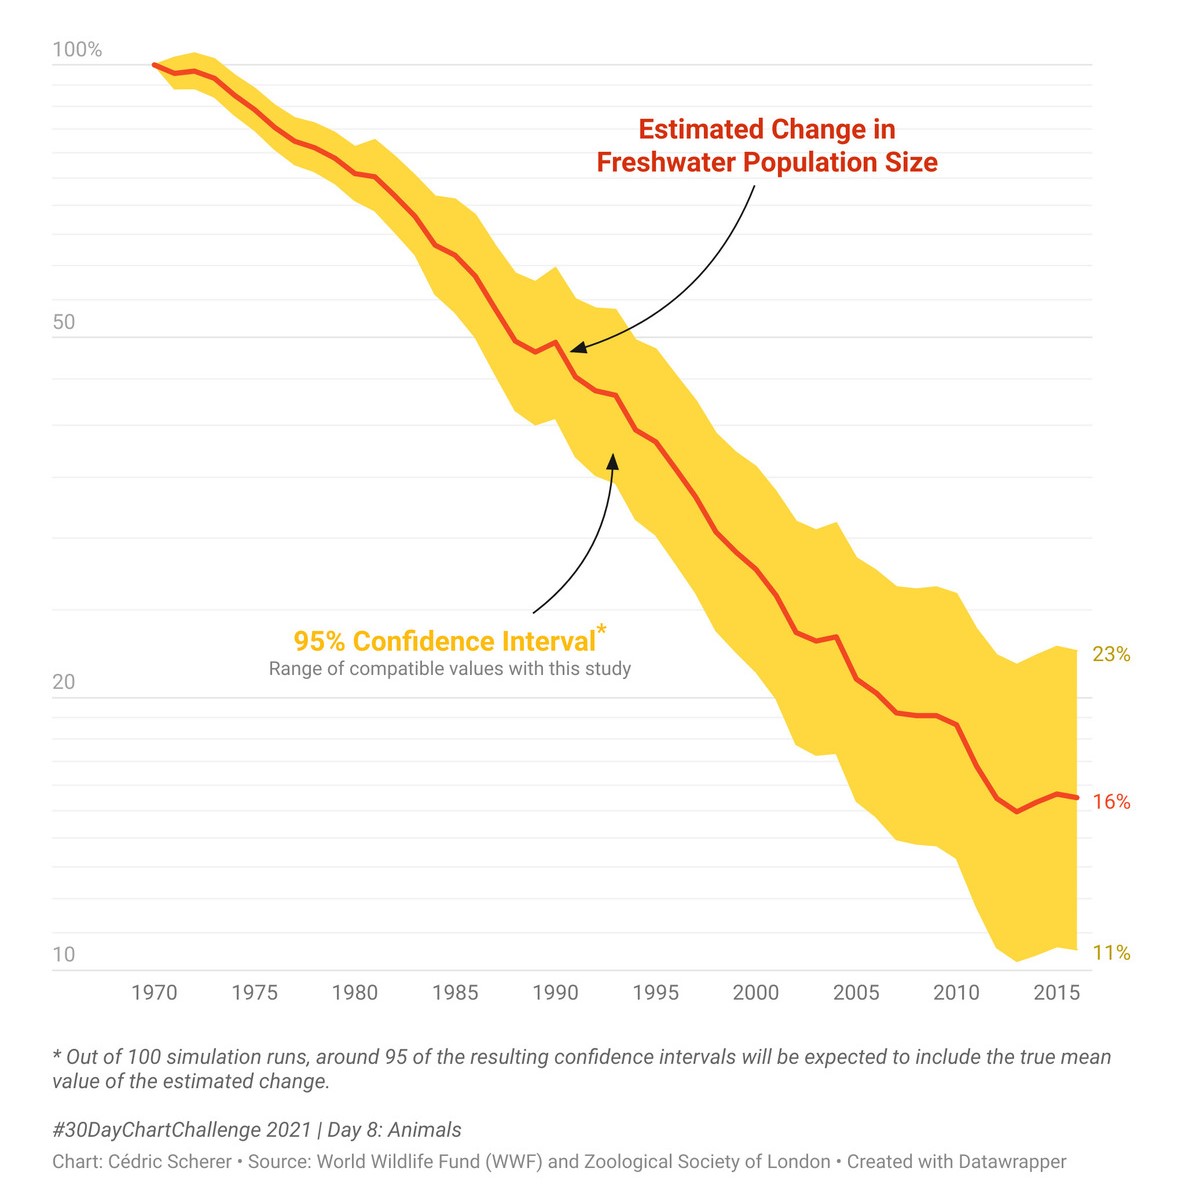
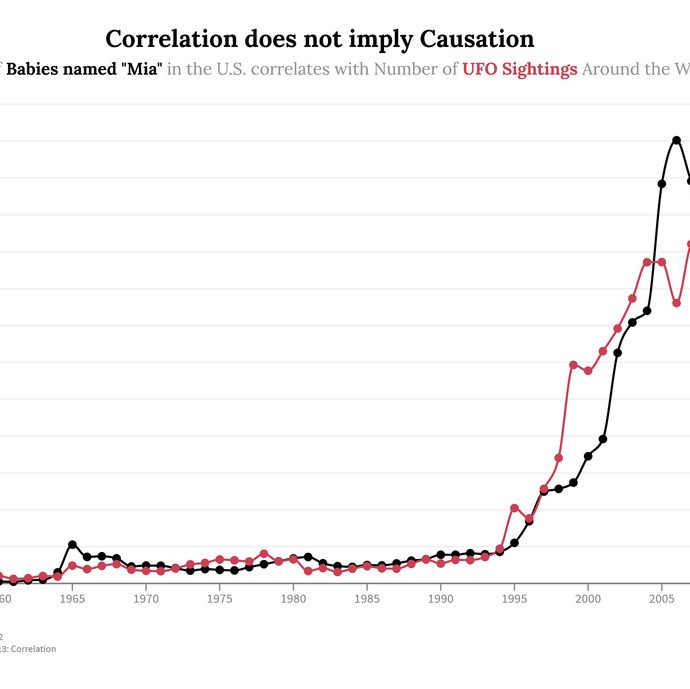
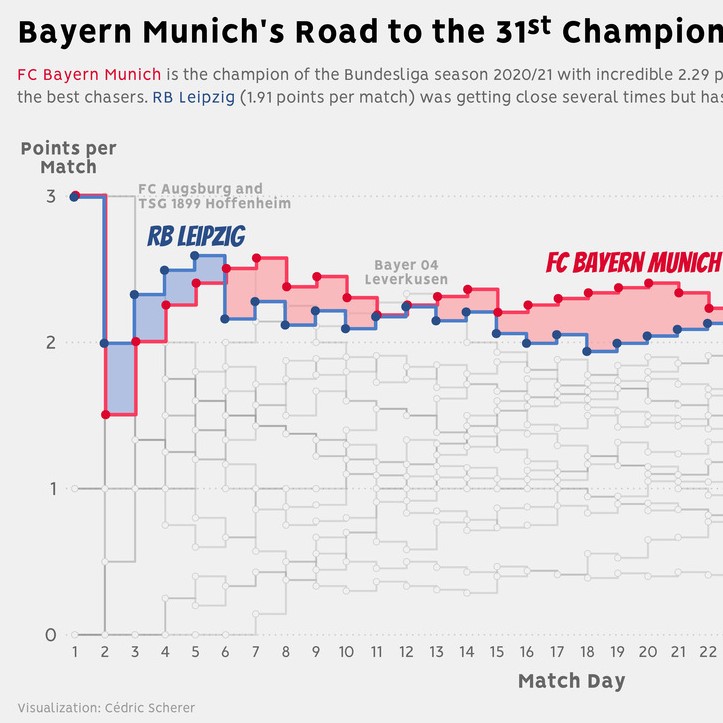
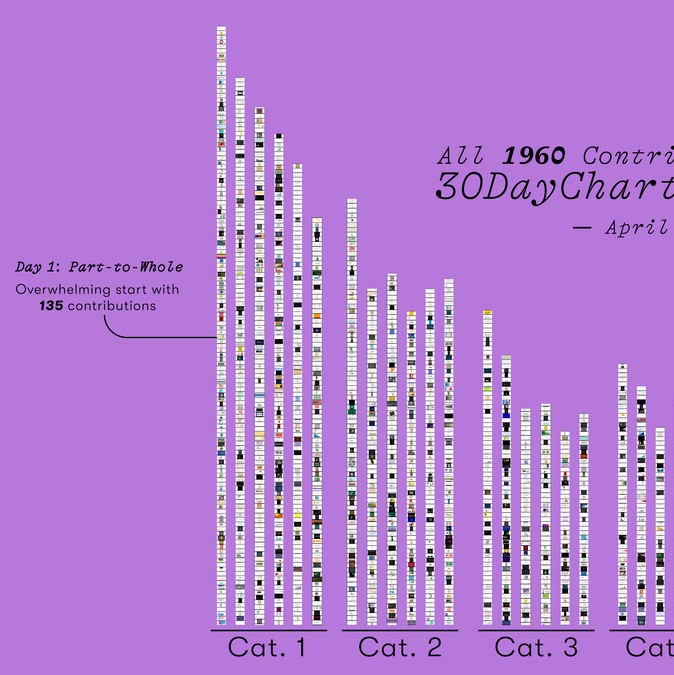
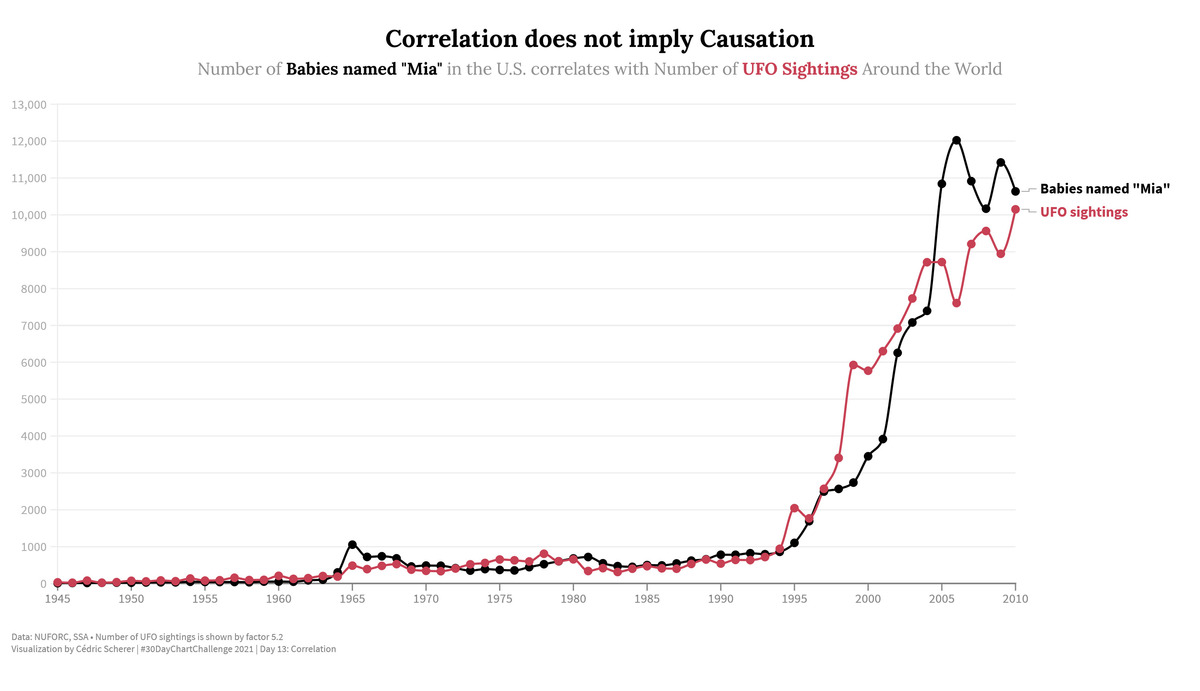
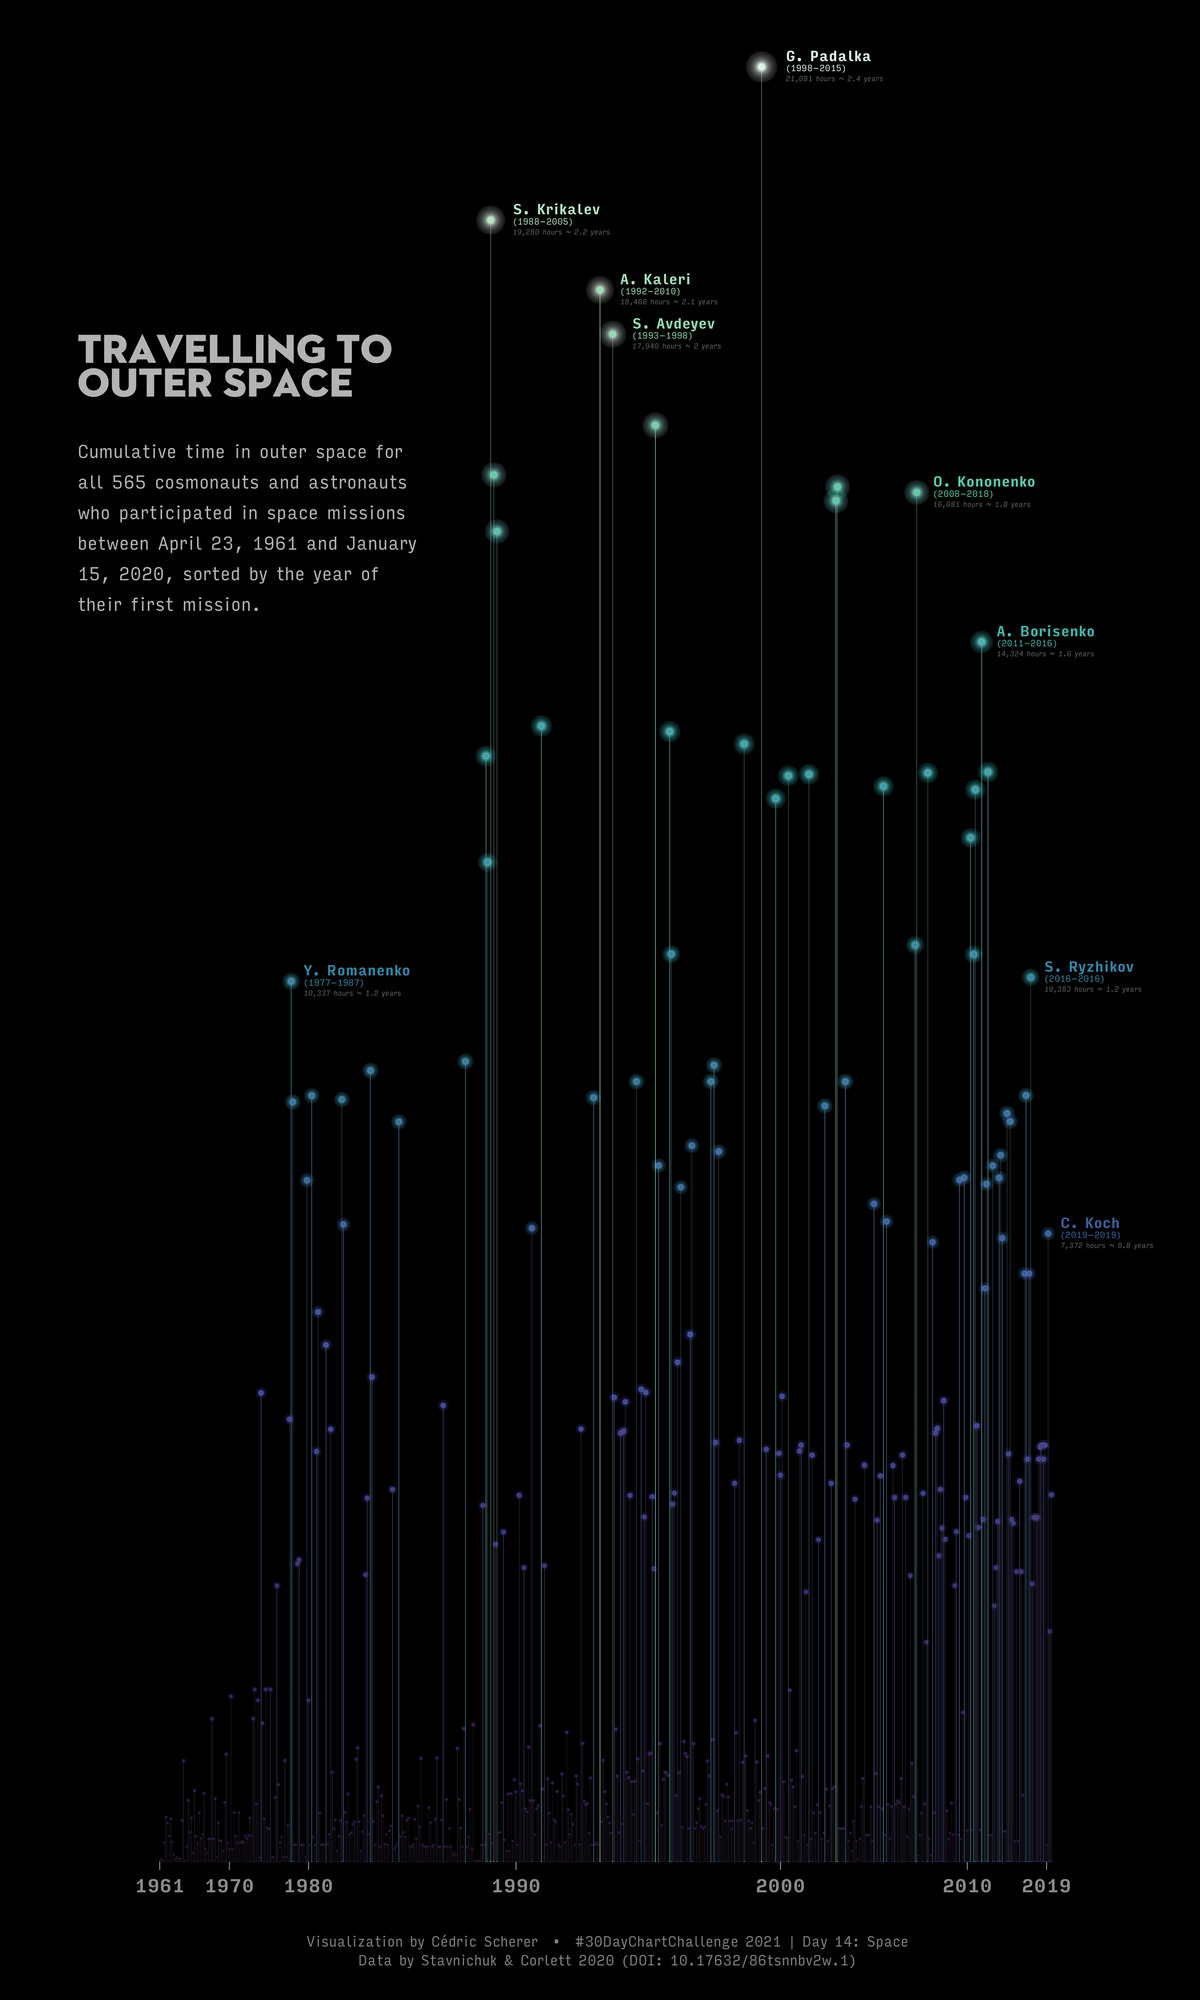
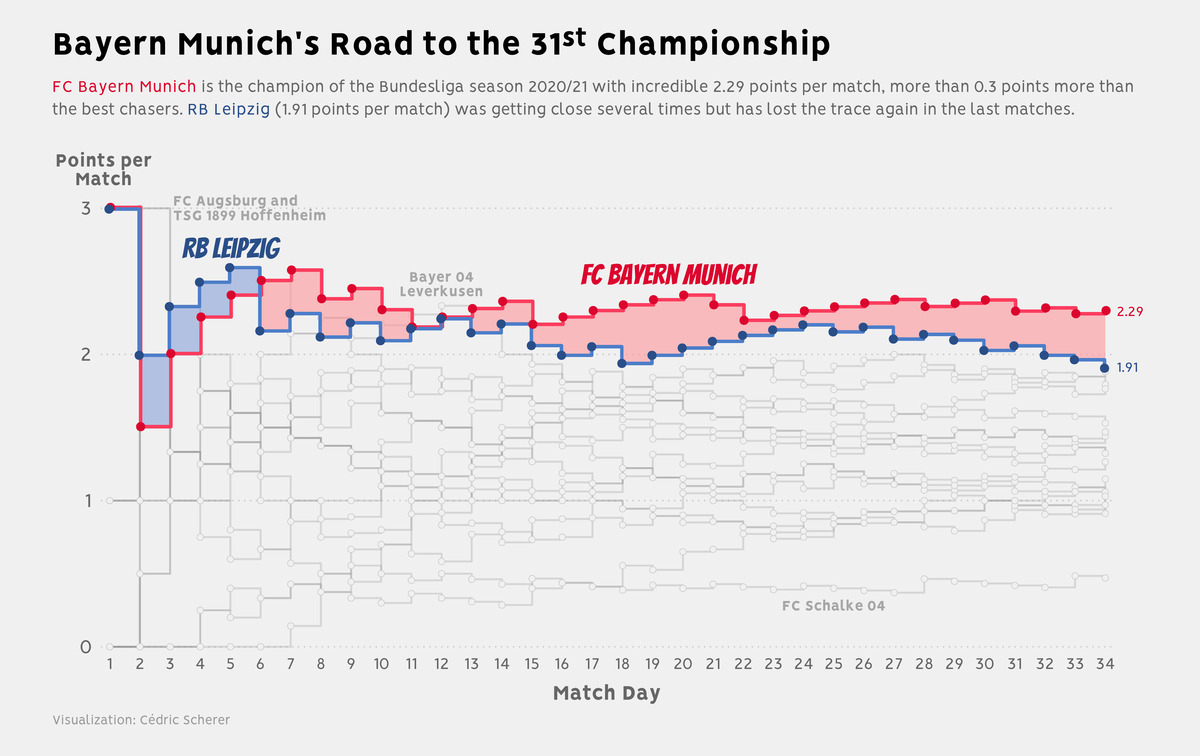
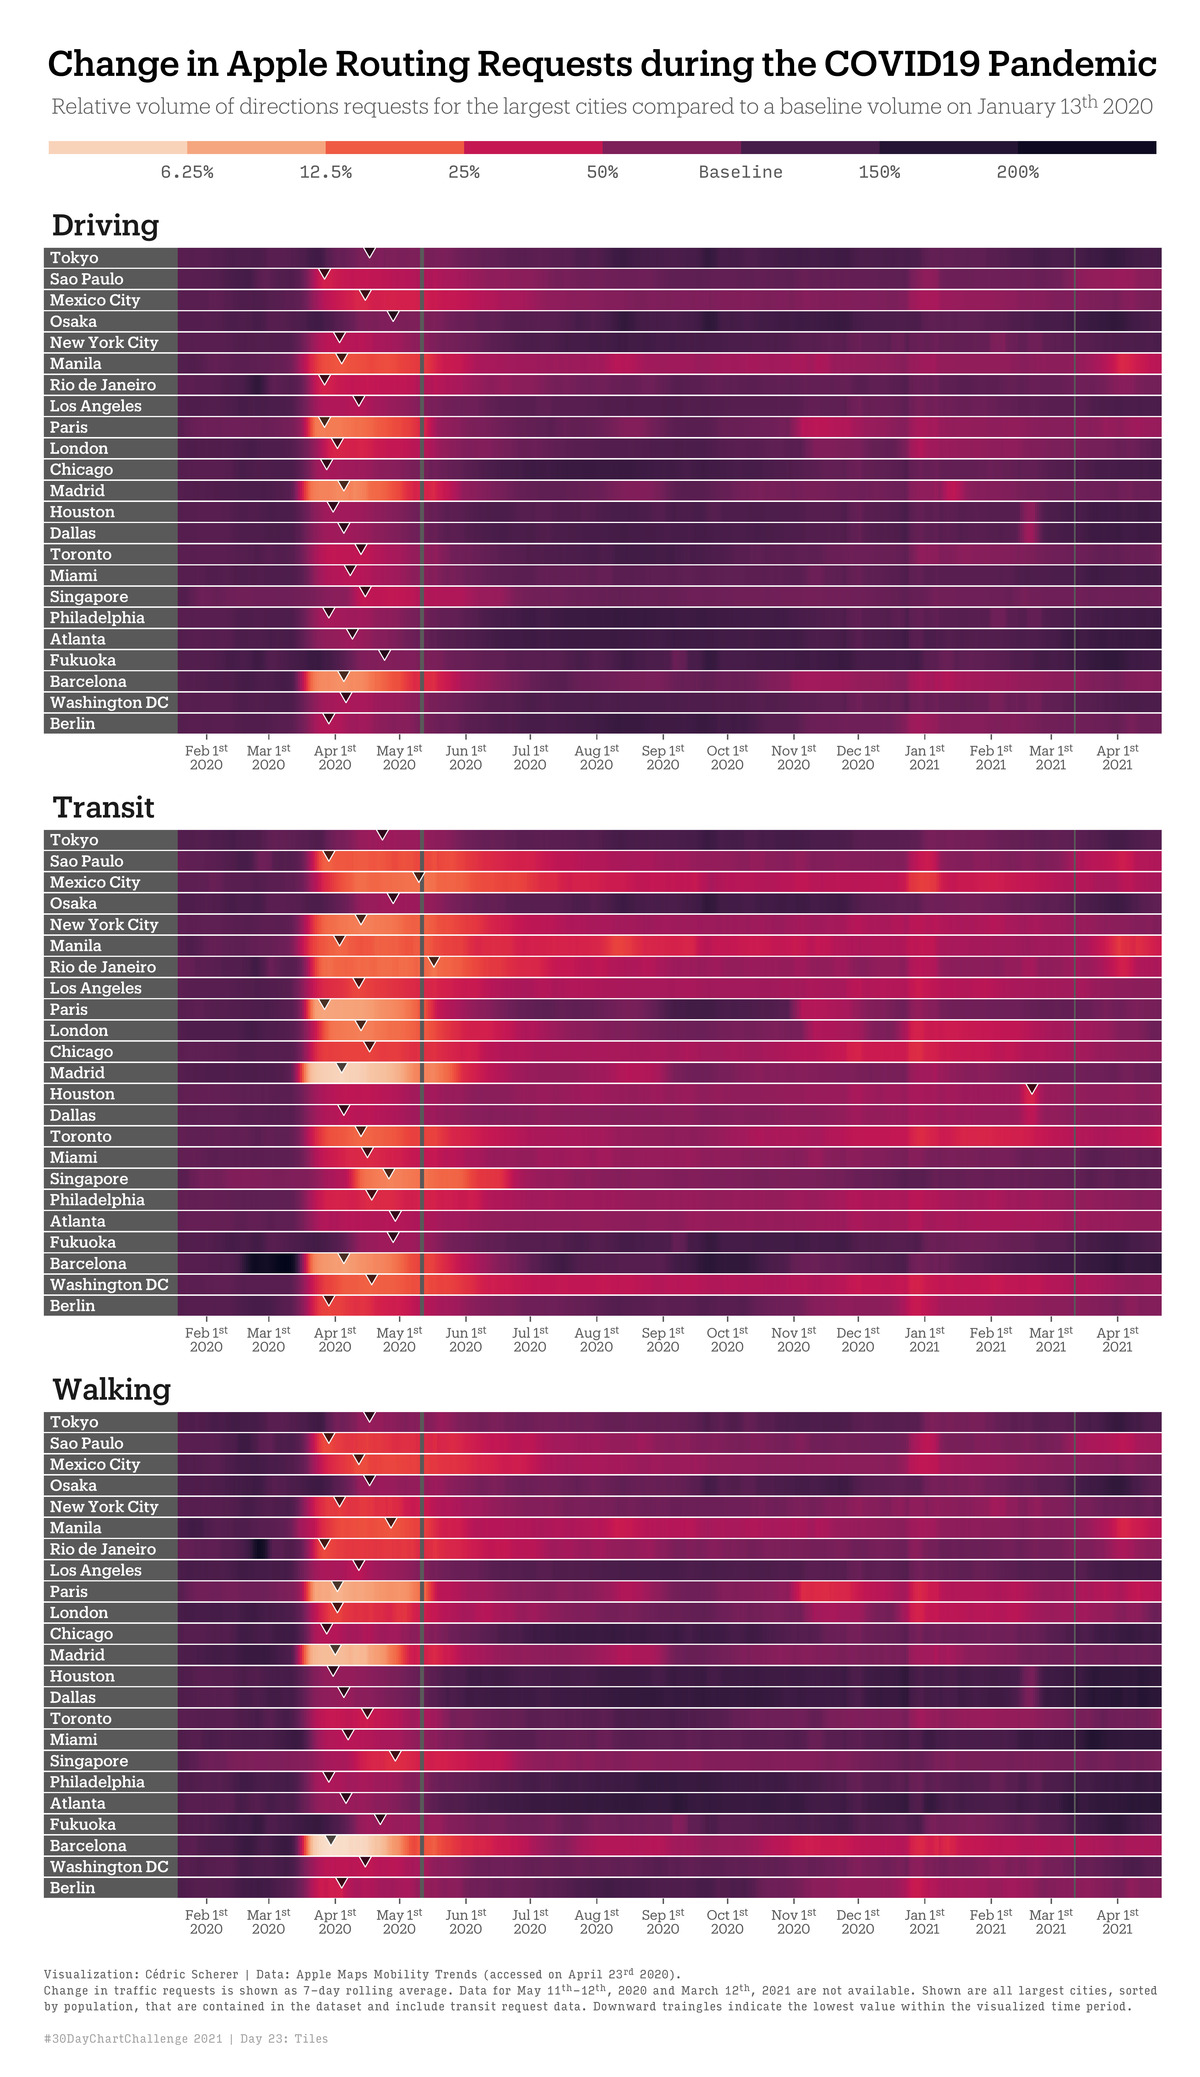
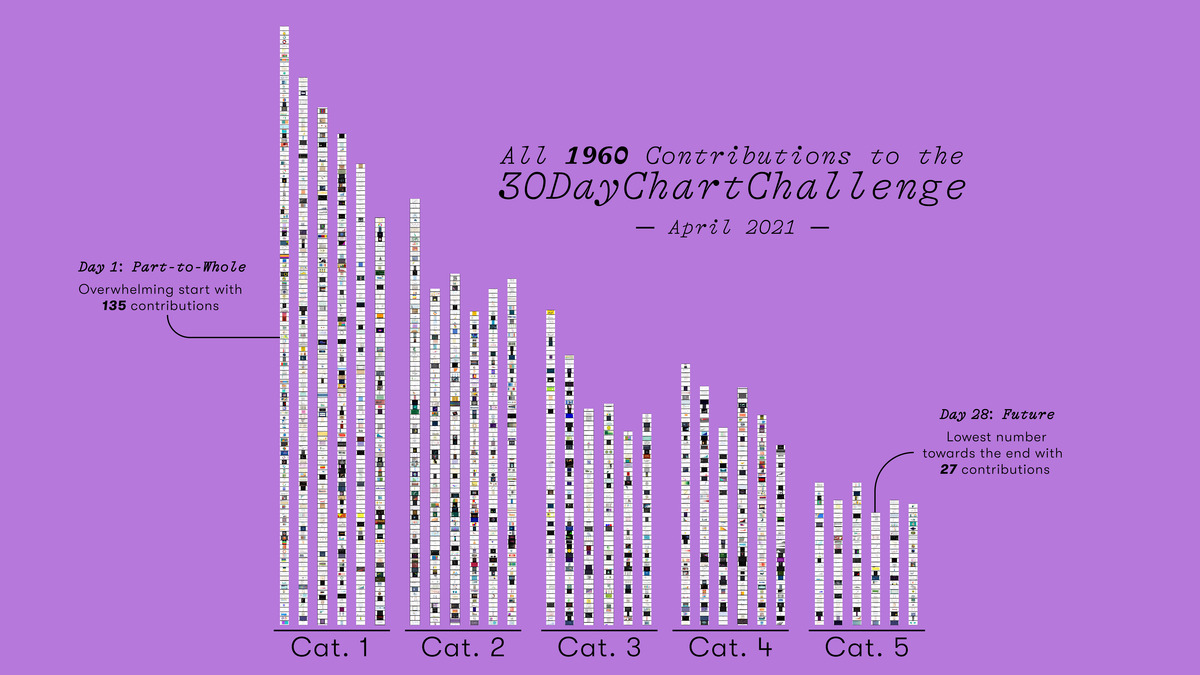
The #30DayChartChallenge is a daily community challenge happening every April and is hosted by Dominic Royé and myself since 2021. The challenge is inspired by the #30DayMapChallenge.
#30DayMapChallenge is a challenge initiated by Topi Tjukanov and took place for the first time in November 2019. I have participated in 2019 and 2021 .
2021 Edition
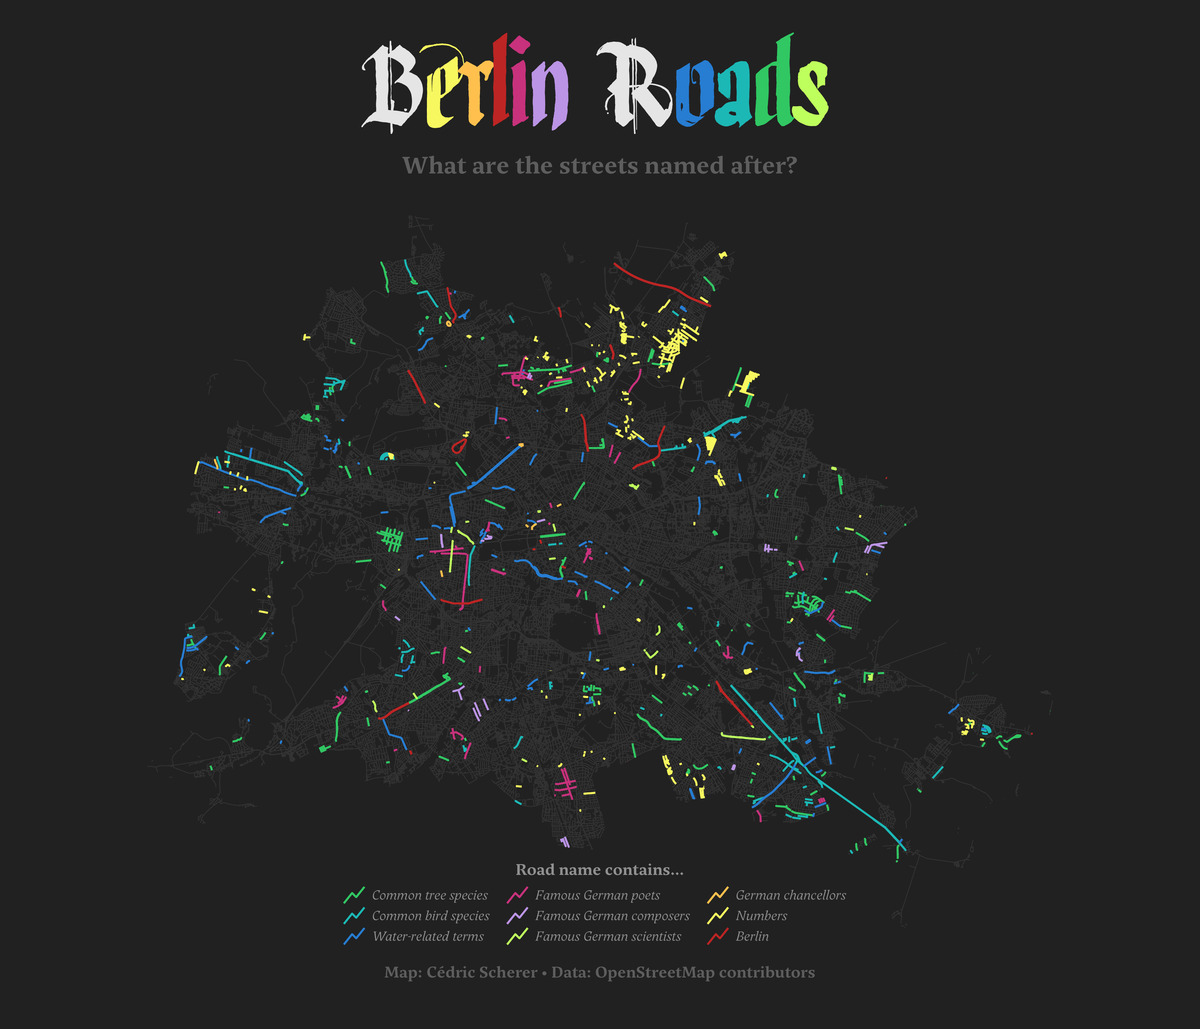
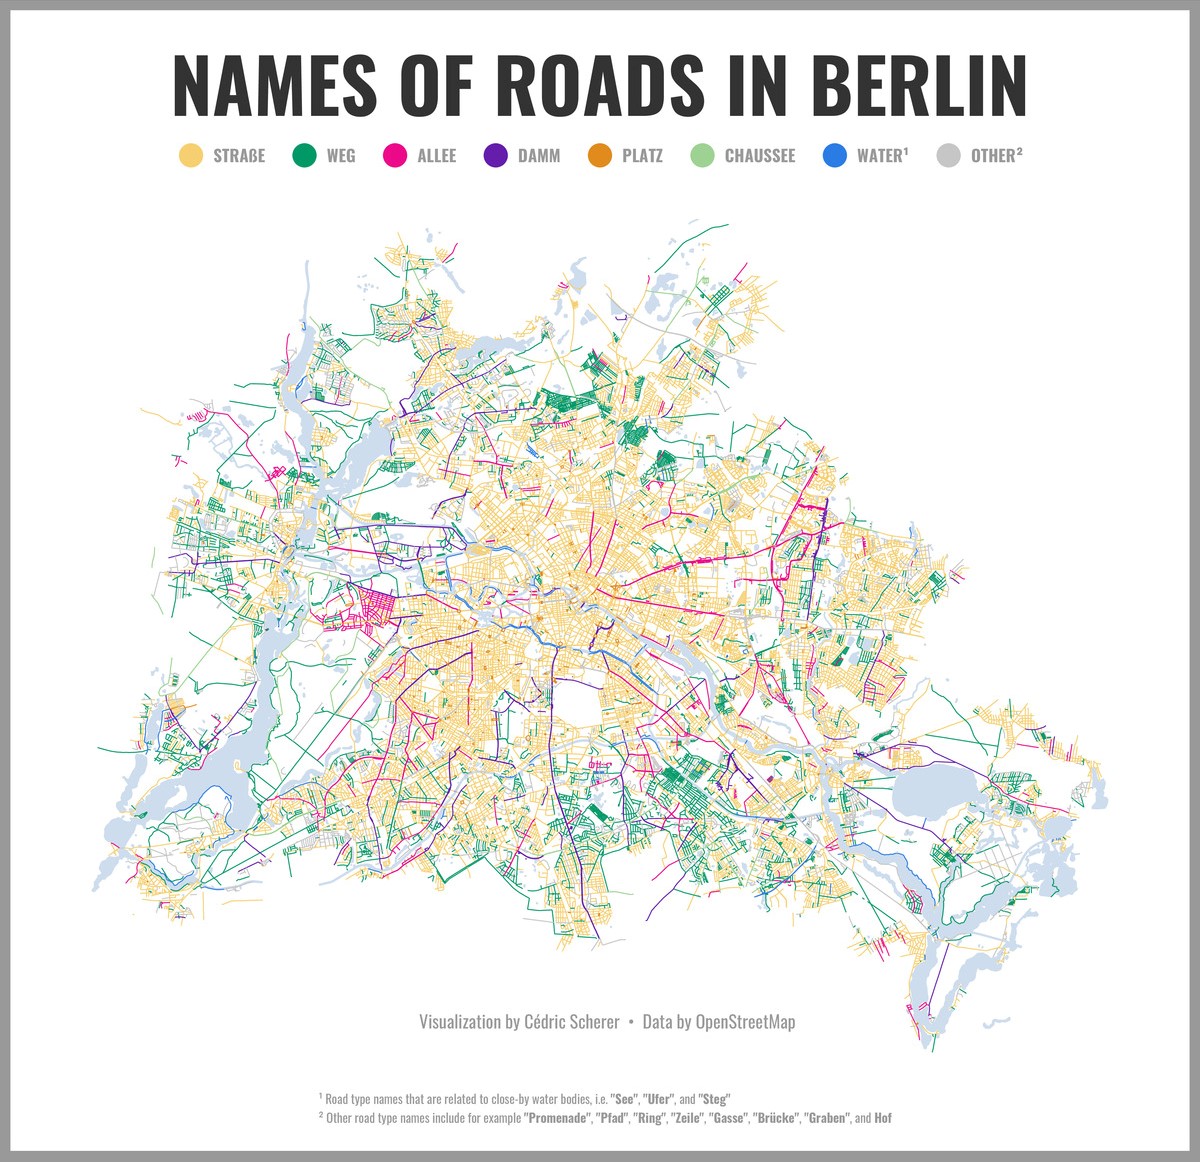
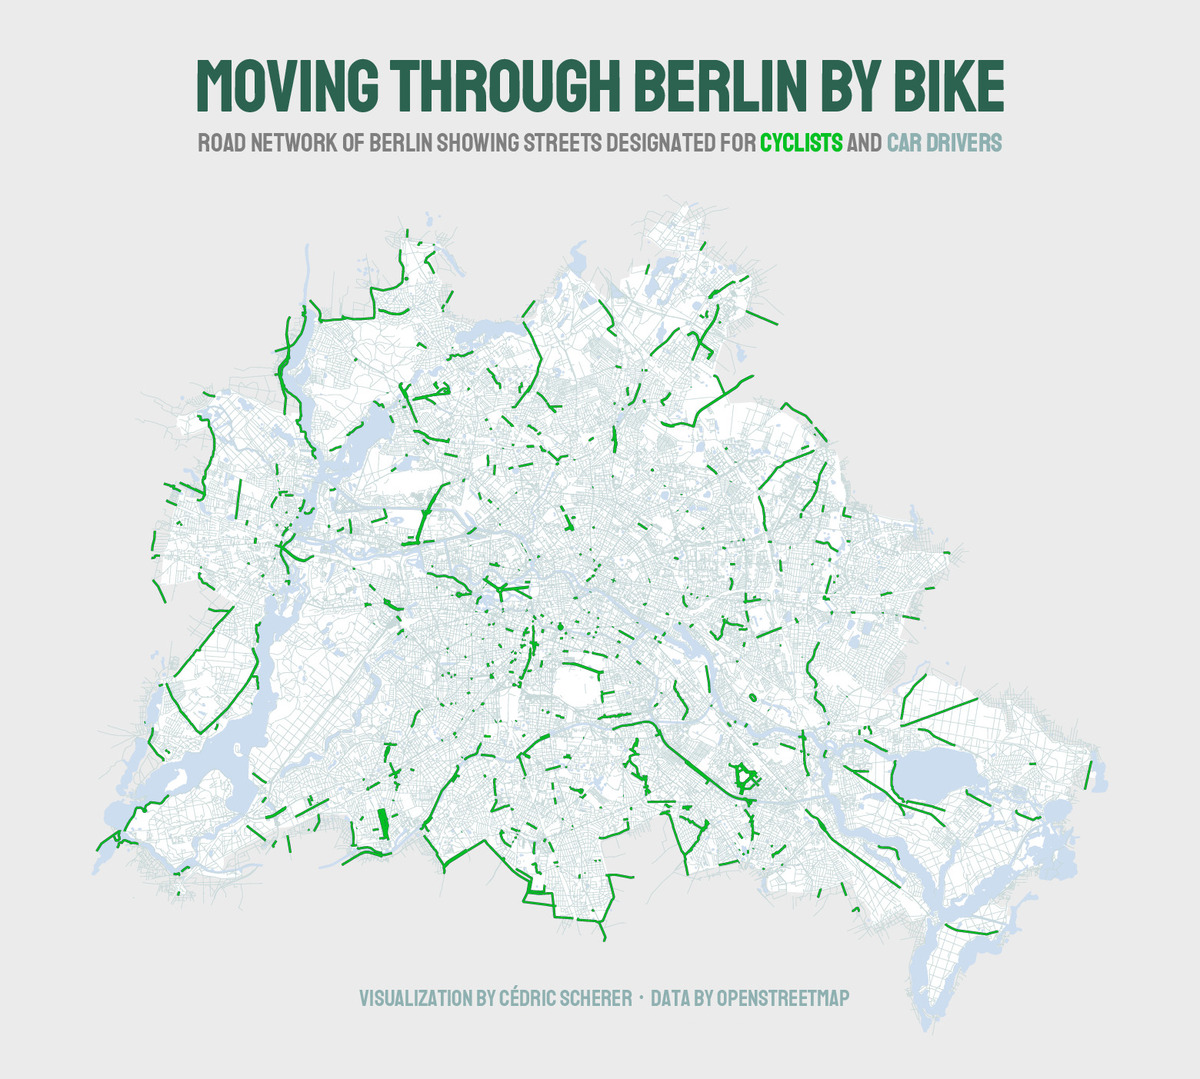
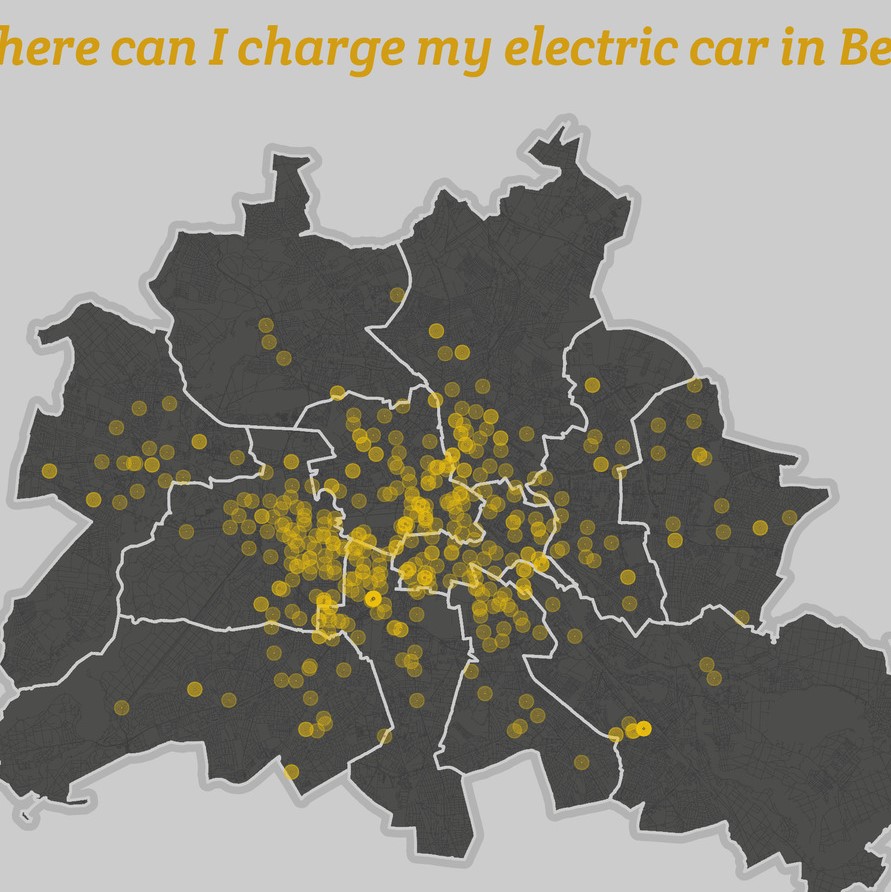
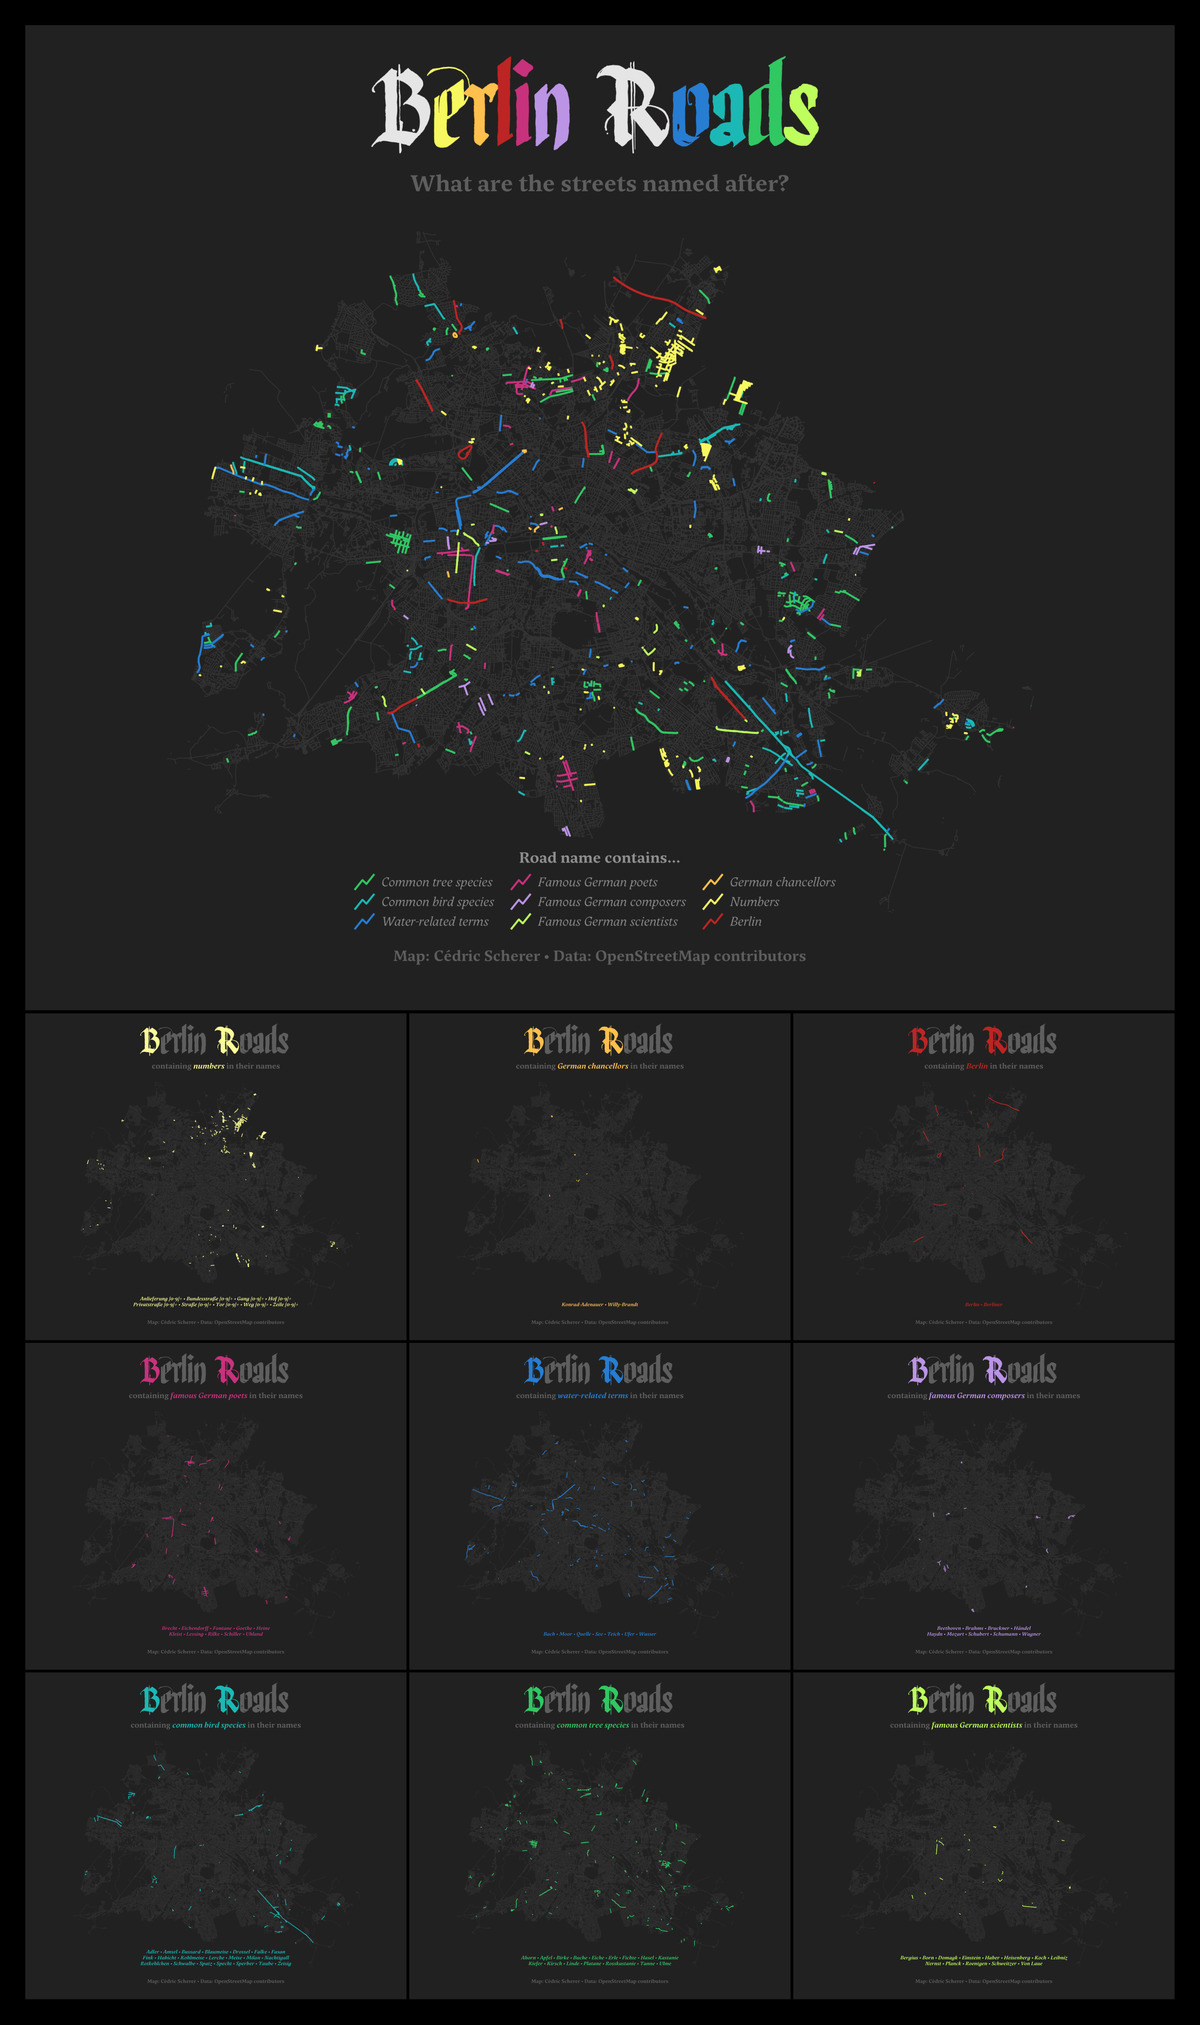
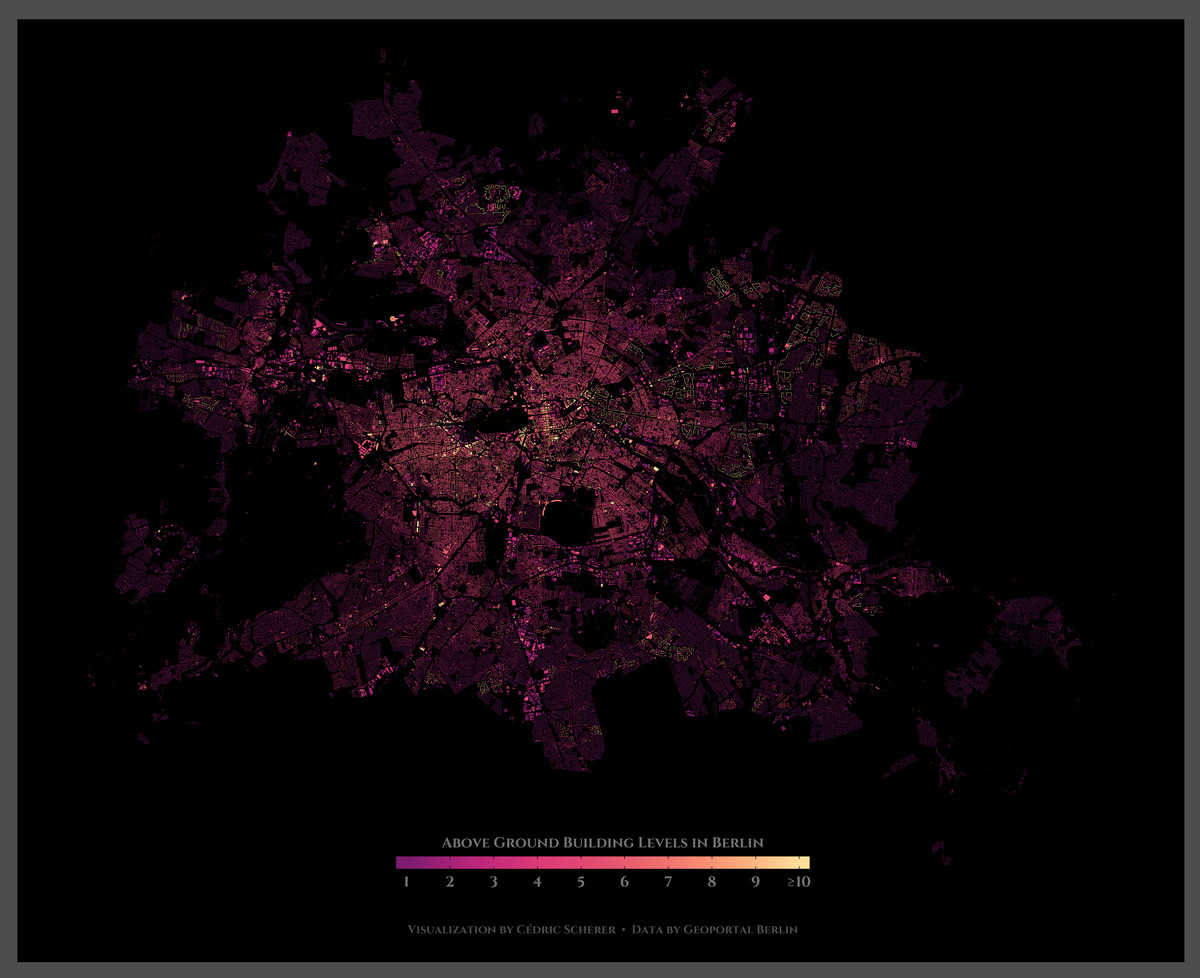
MapChallenge 2021 Day 02 Lines Berlin Roads
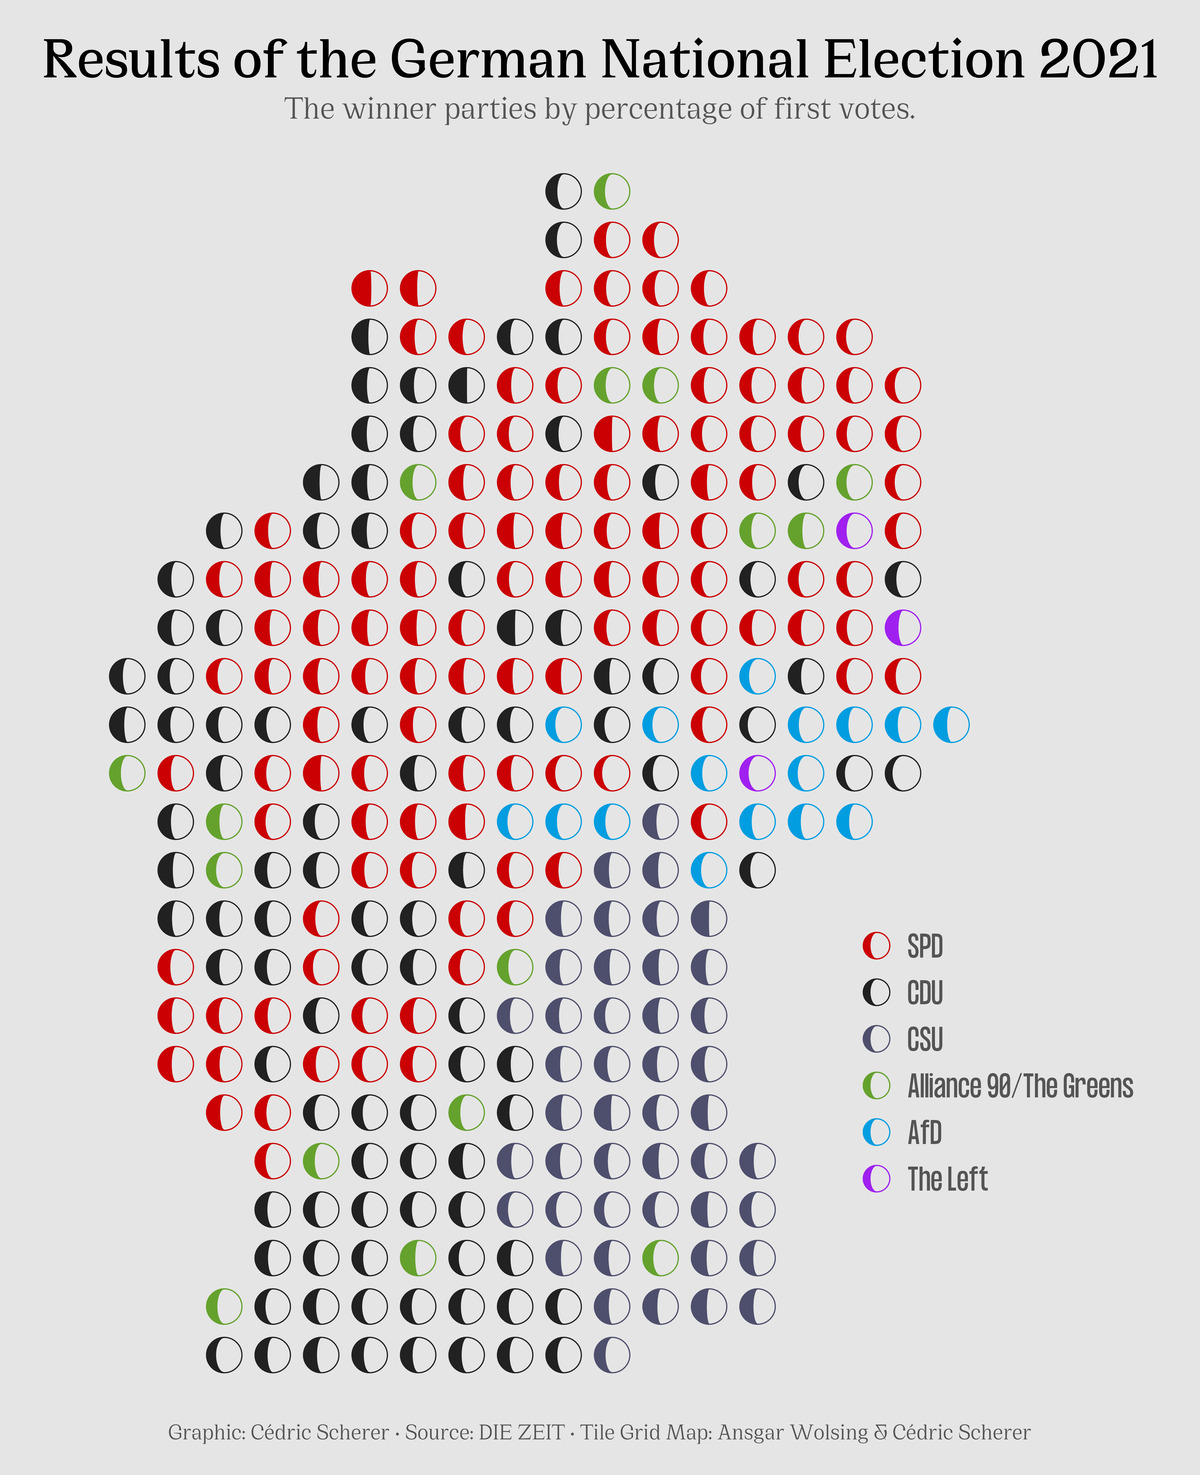
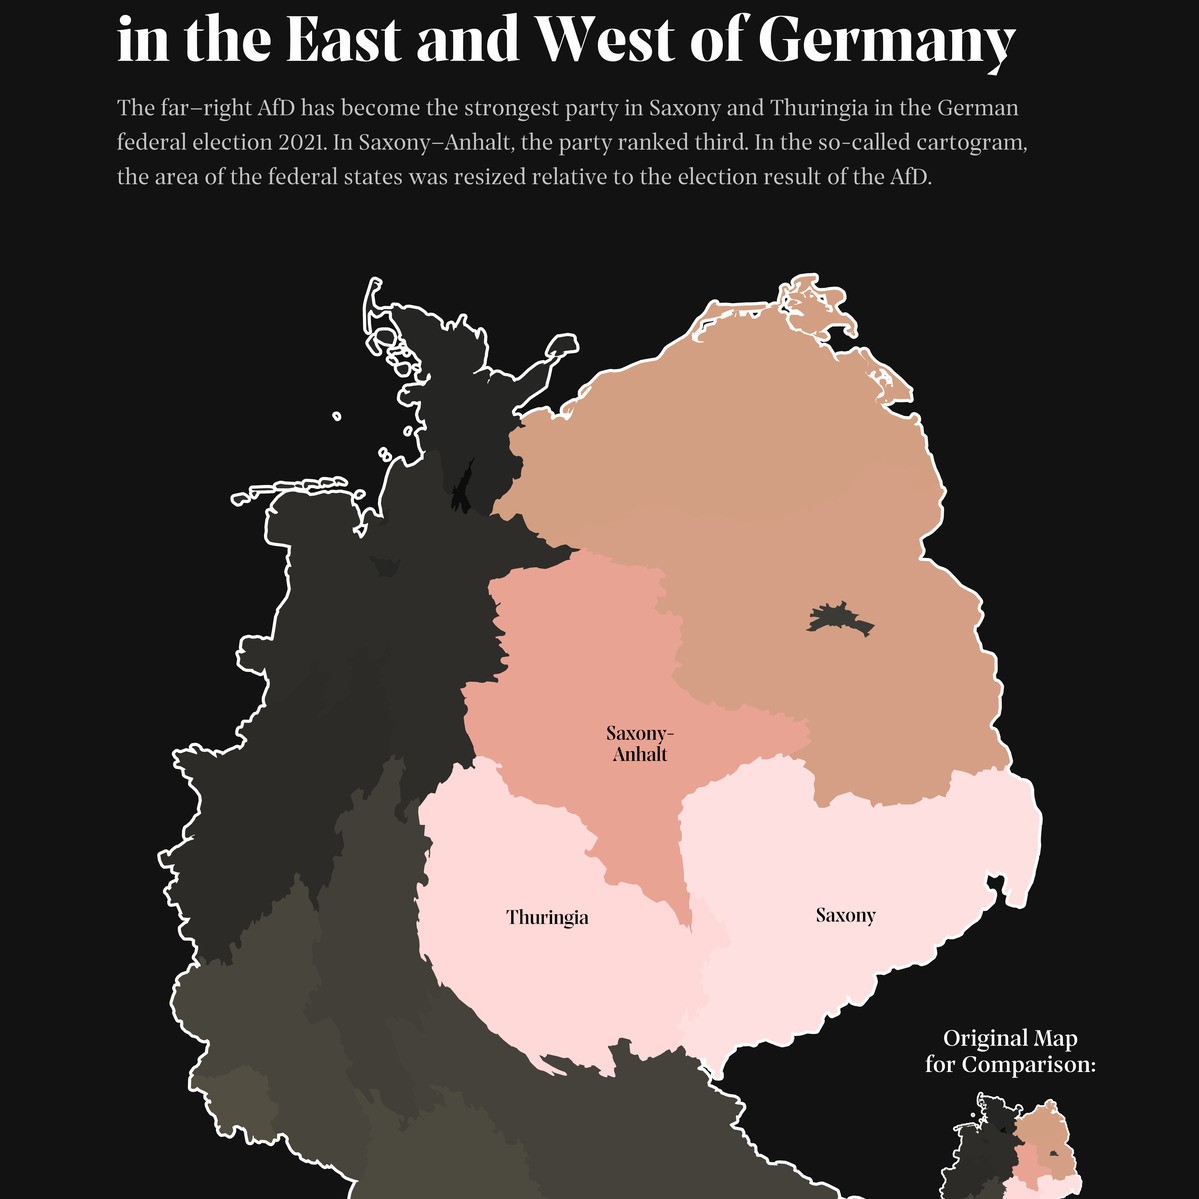
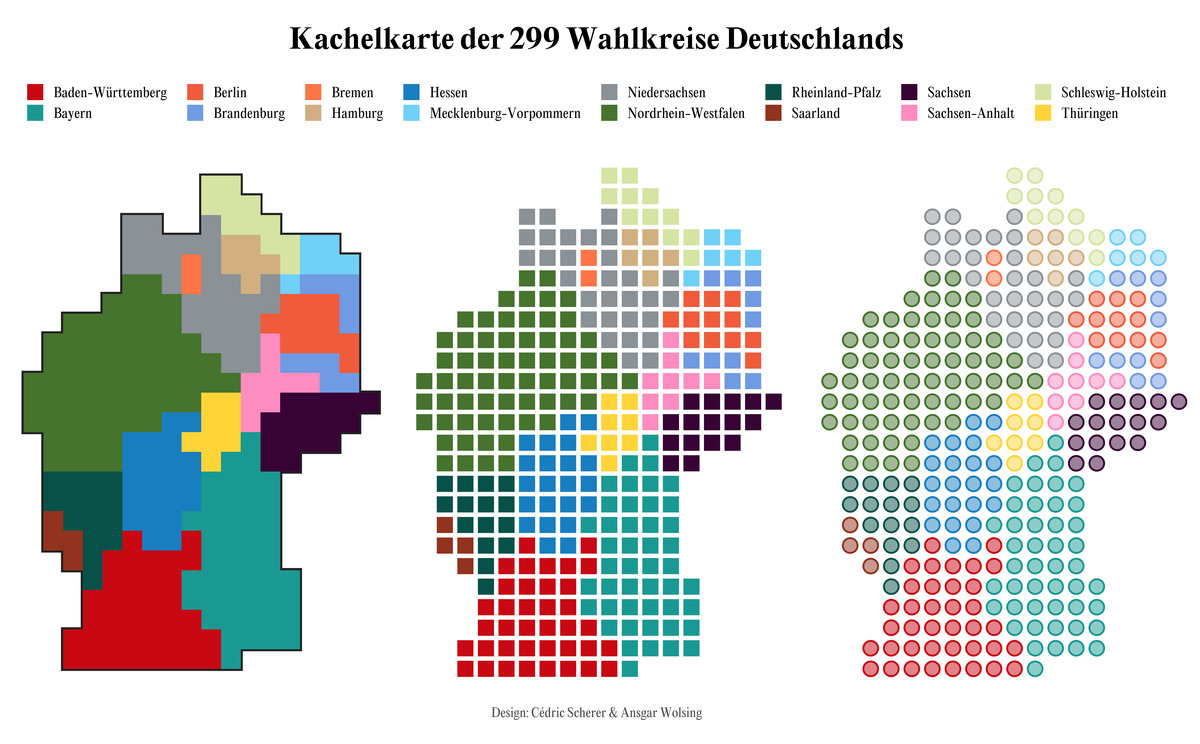
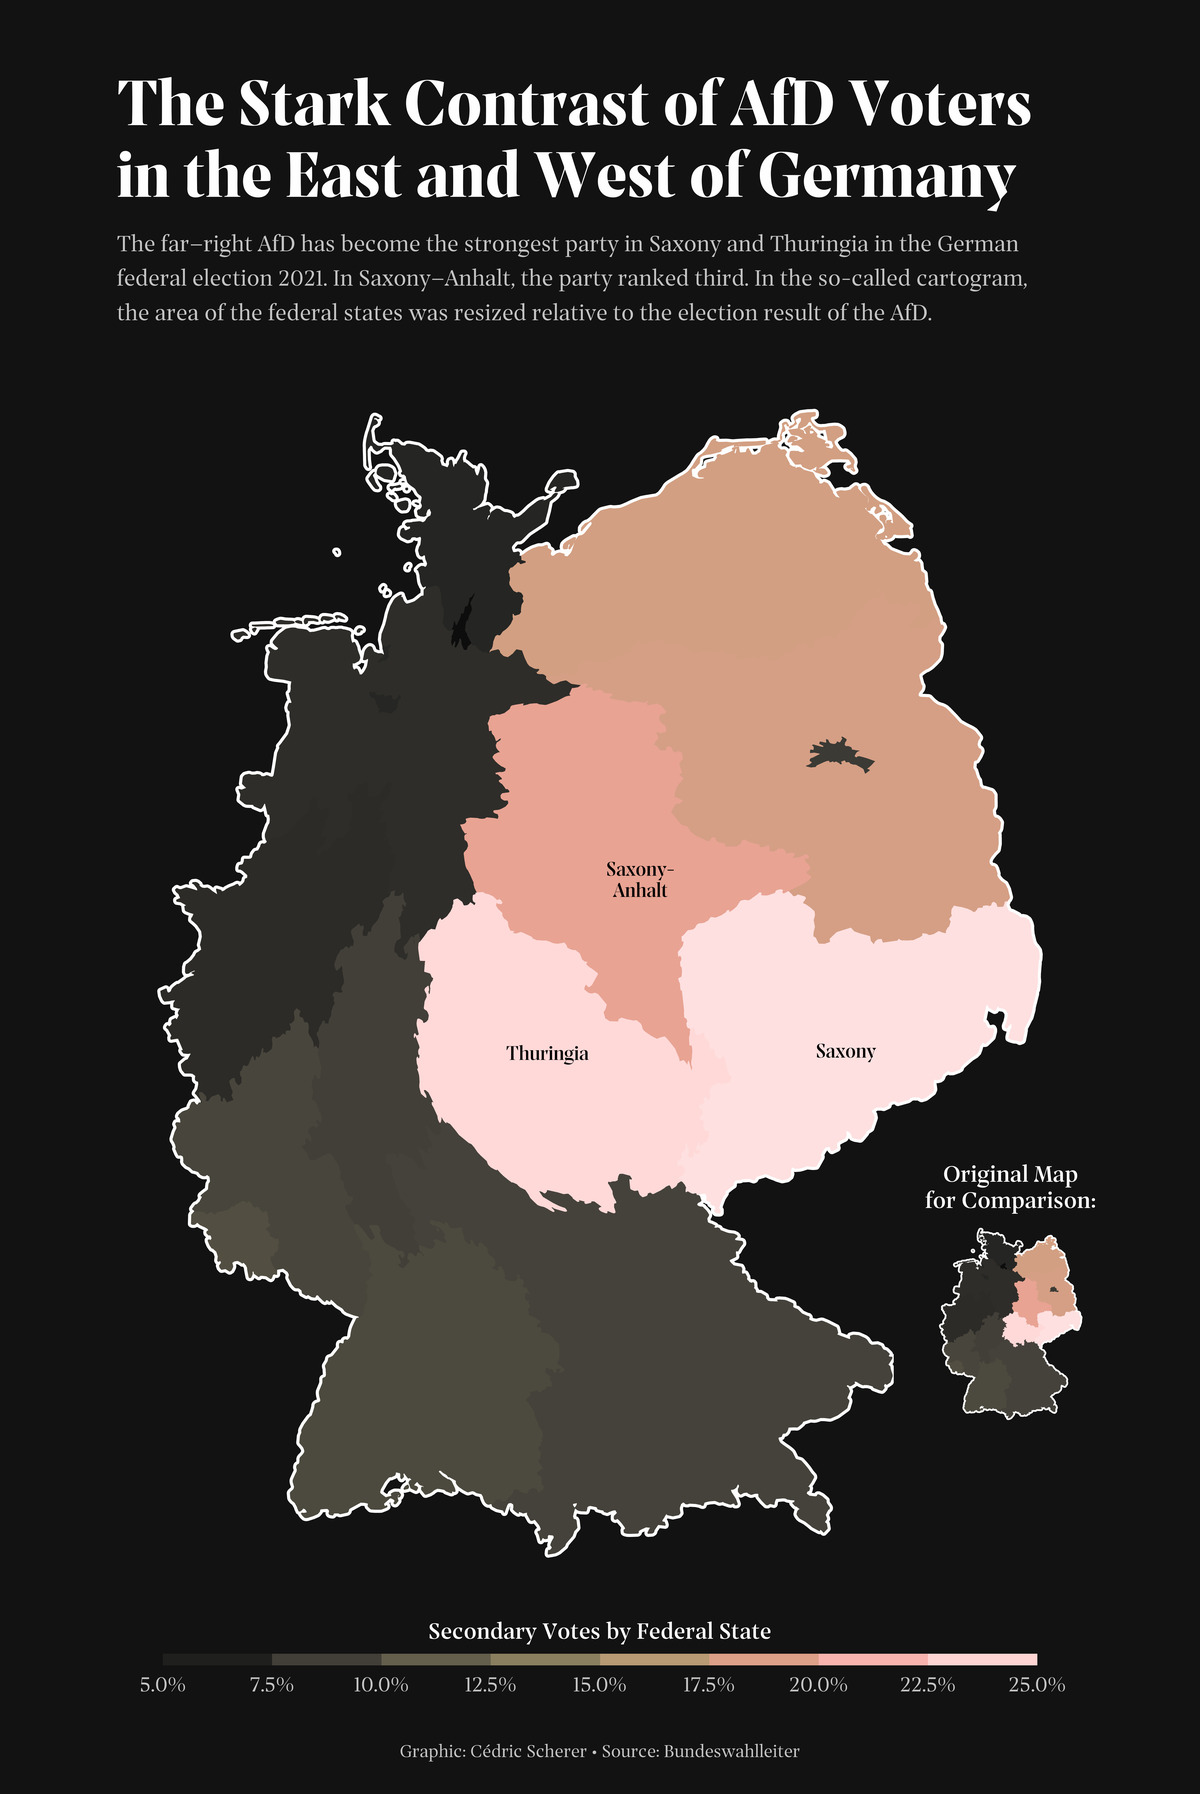
MapChallenge 2021 Day 03 Polygons Cartogram Bundestagswahl21 AfD
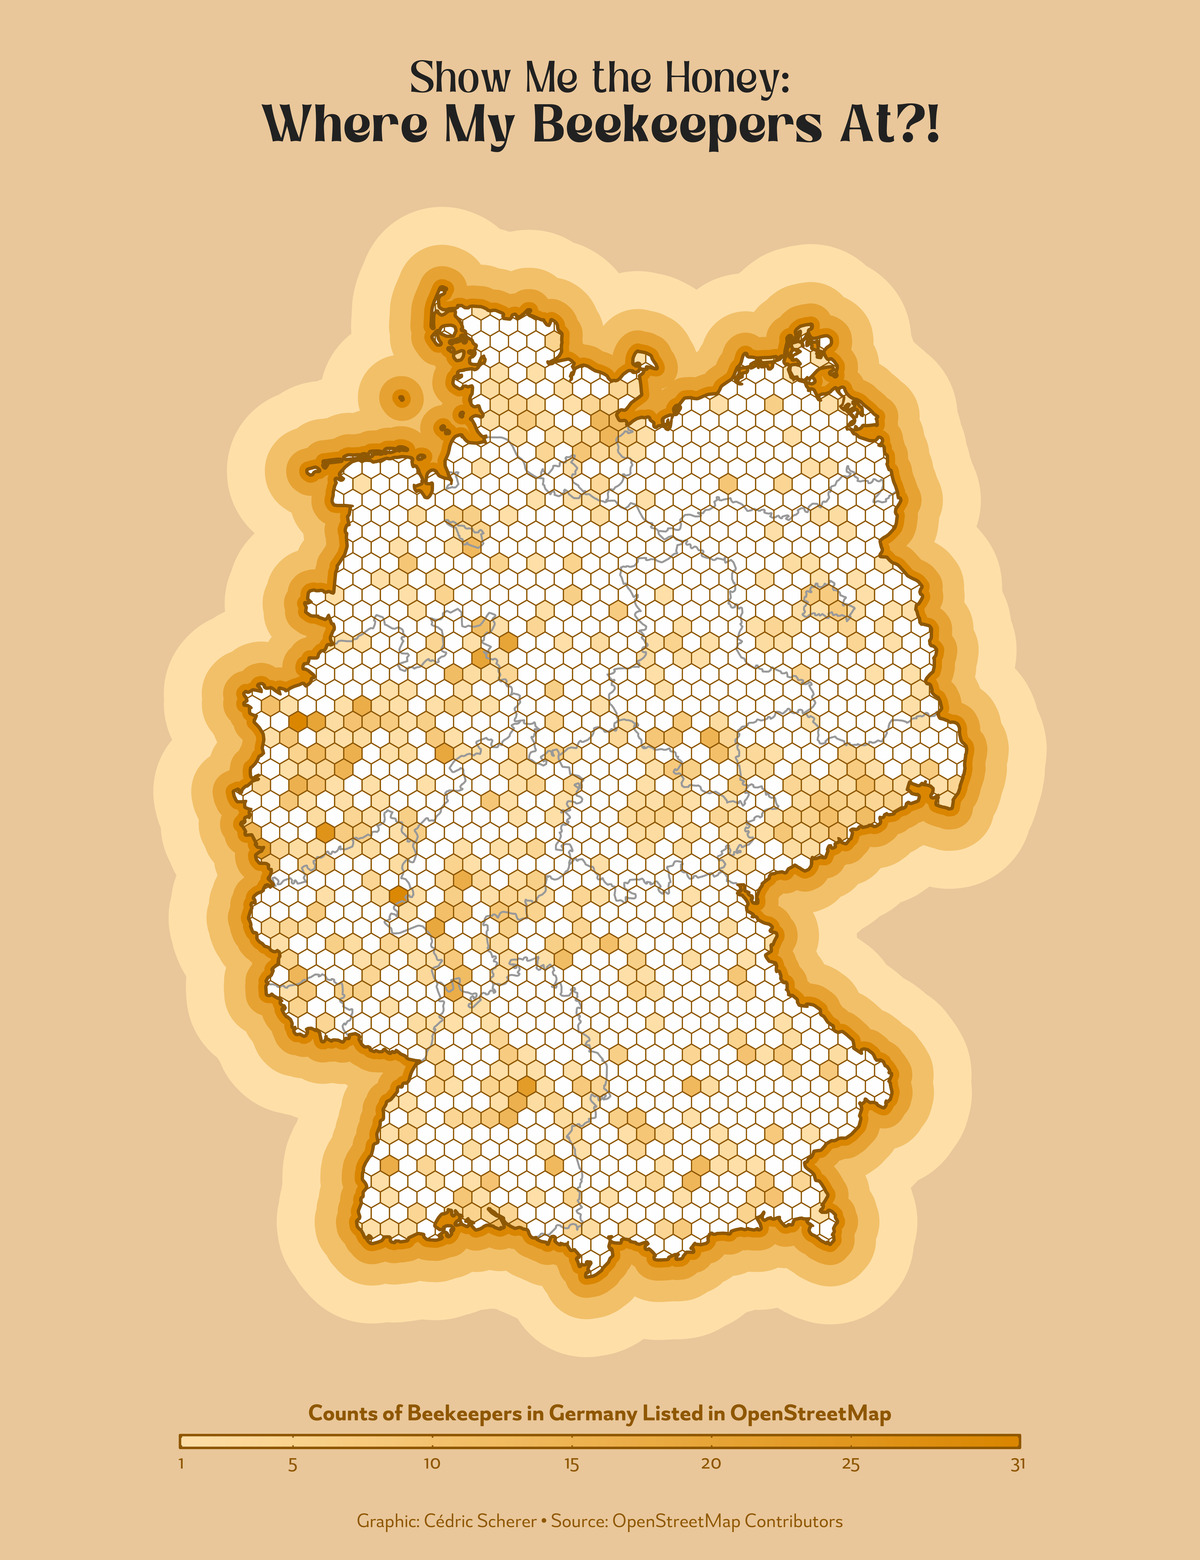
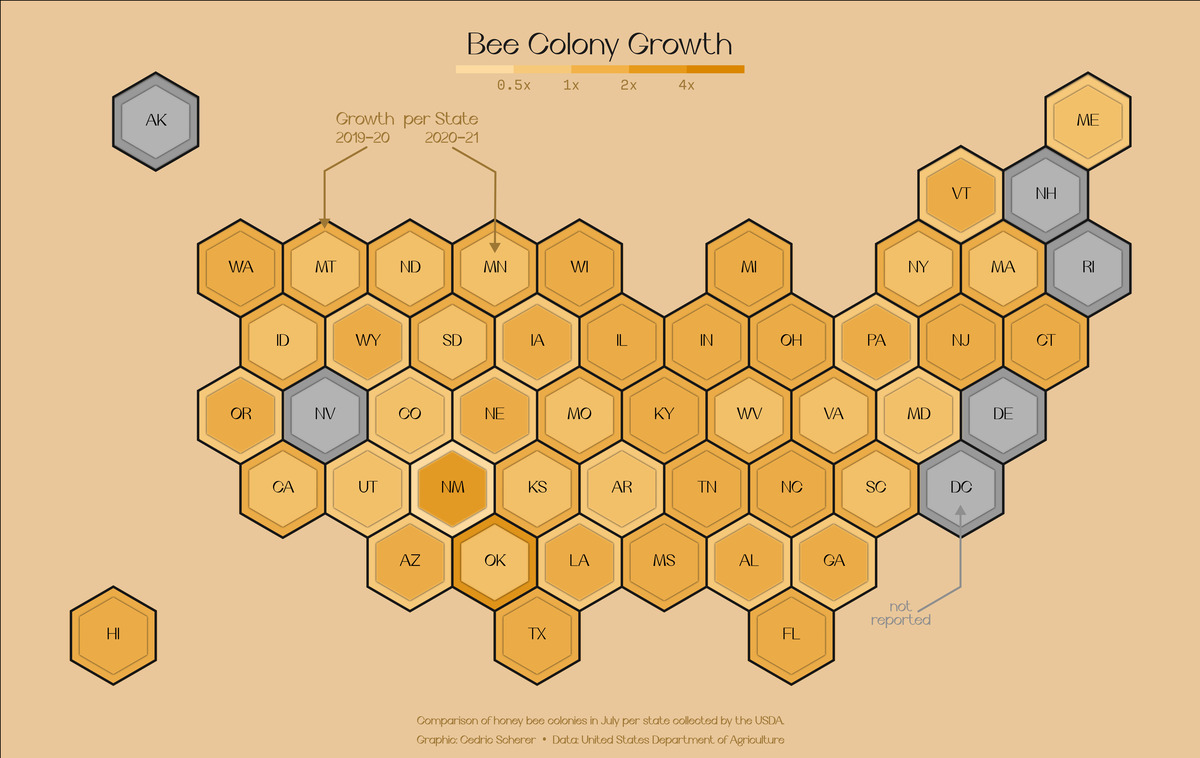
MapChallenge 2021 Day 04 Hexagons US Bee Colonies
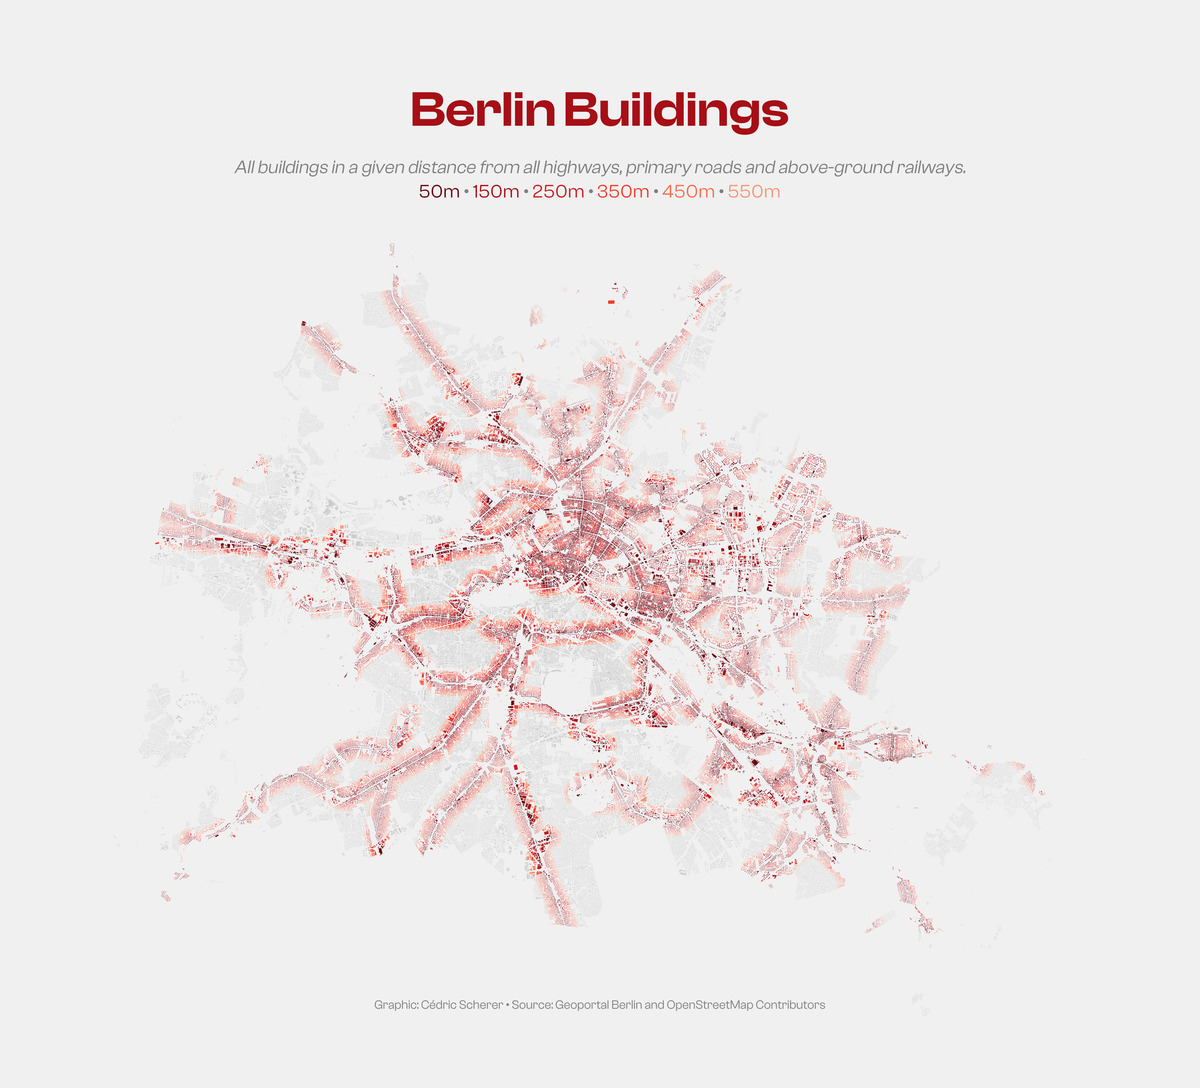
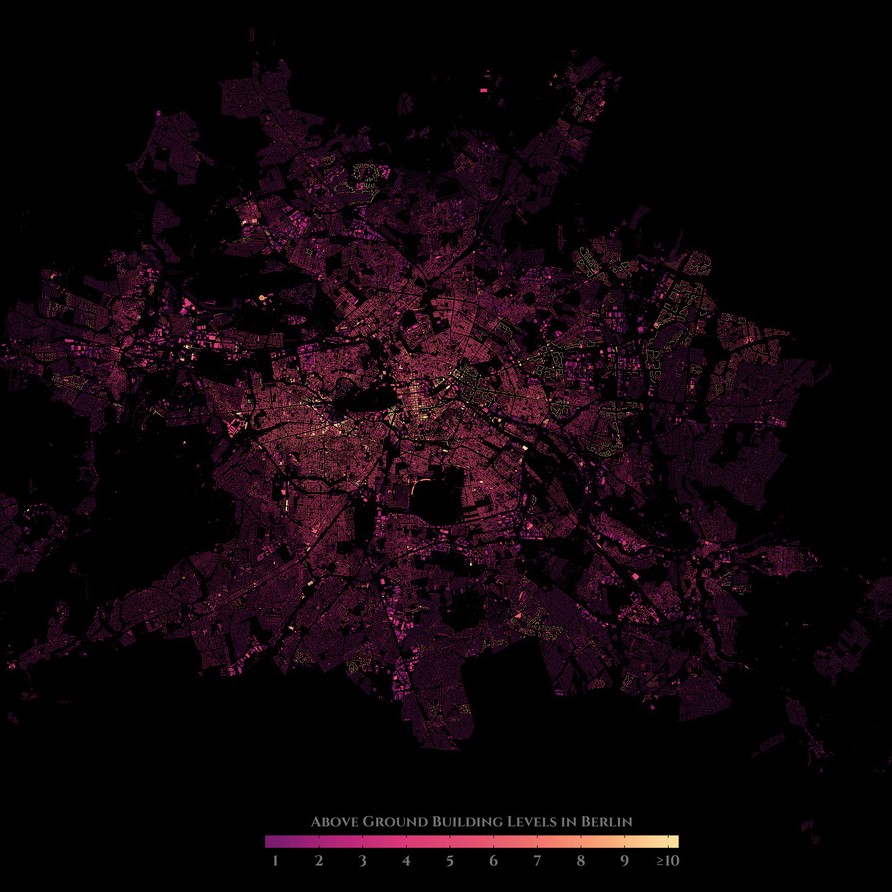
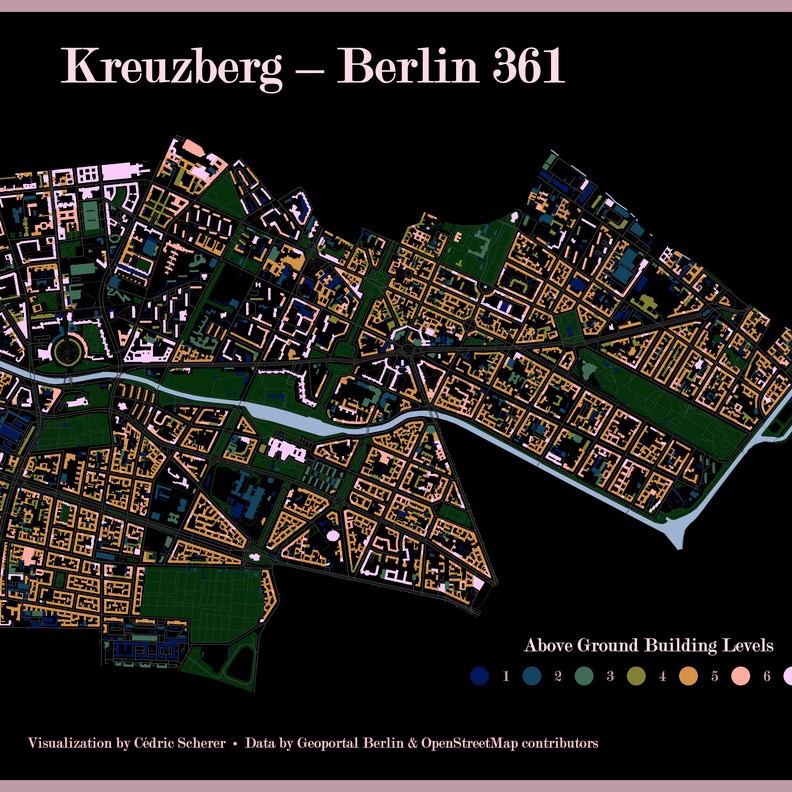
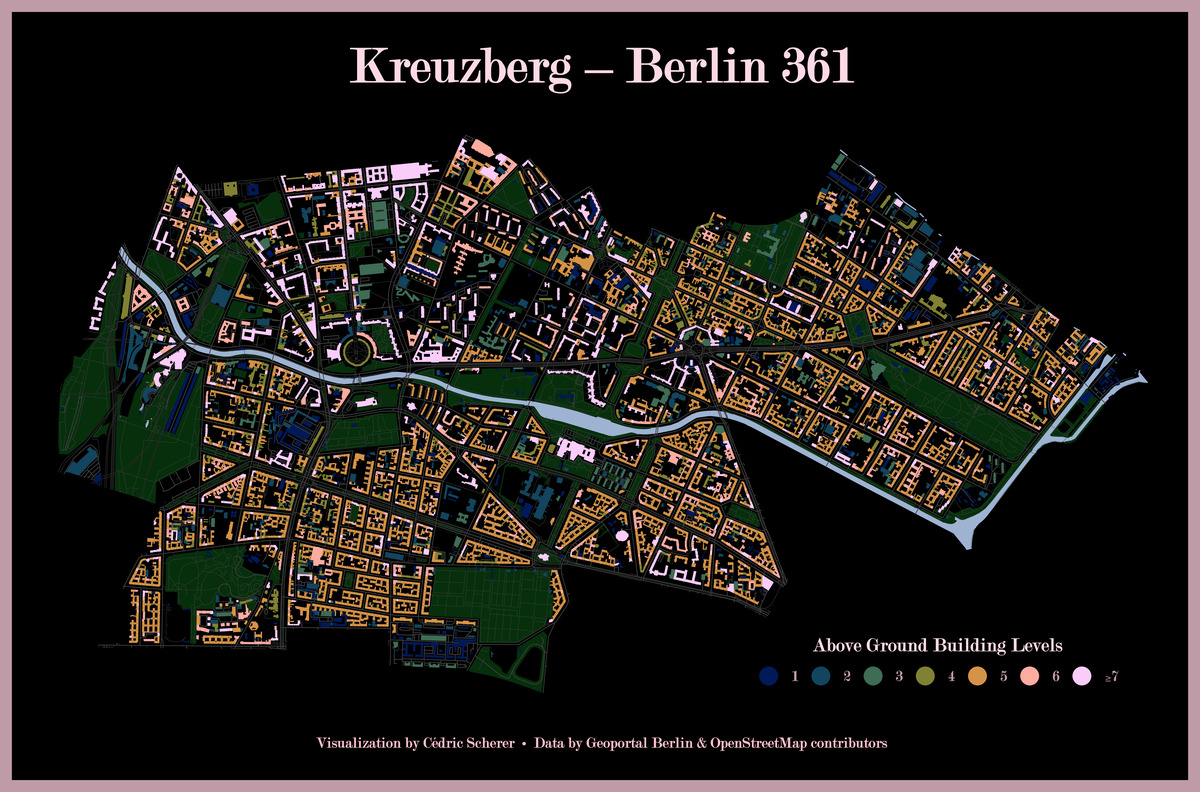
MapChallenge 2021 Day 06 Red Berlin Buildings Dtance Roads Railways
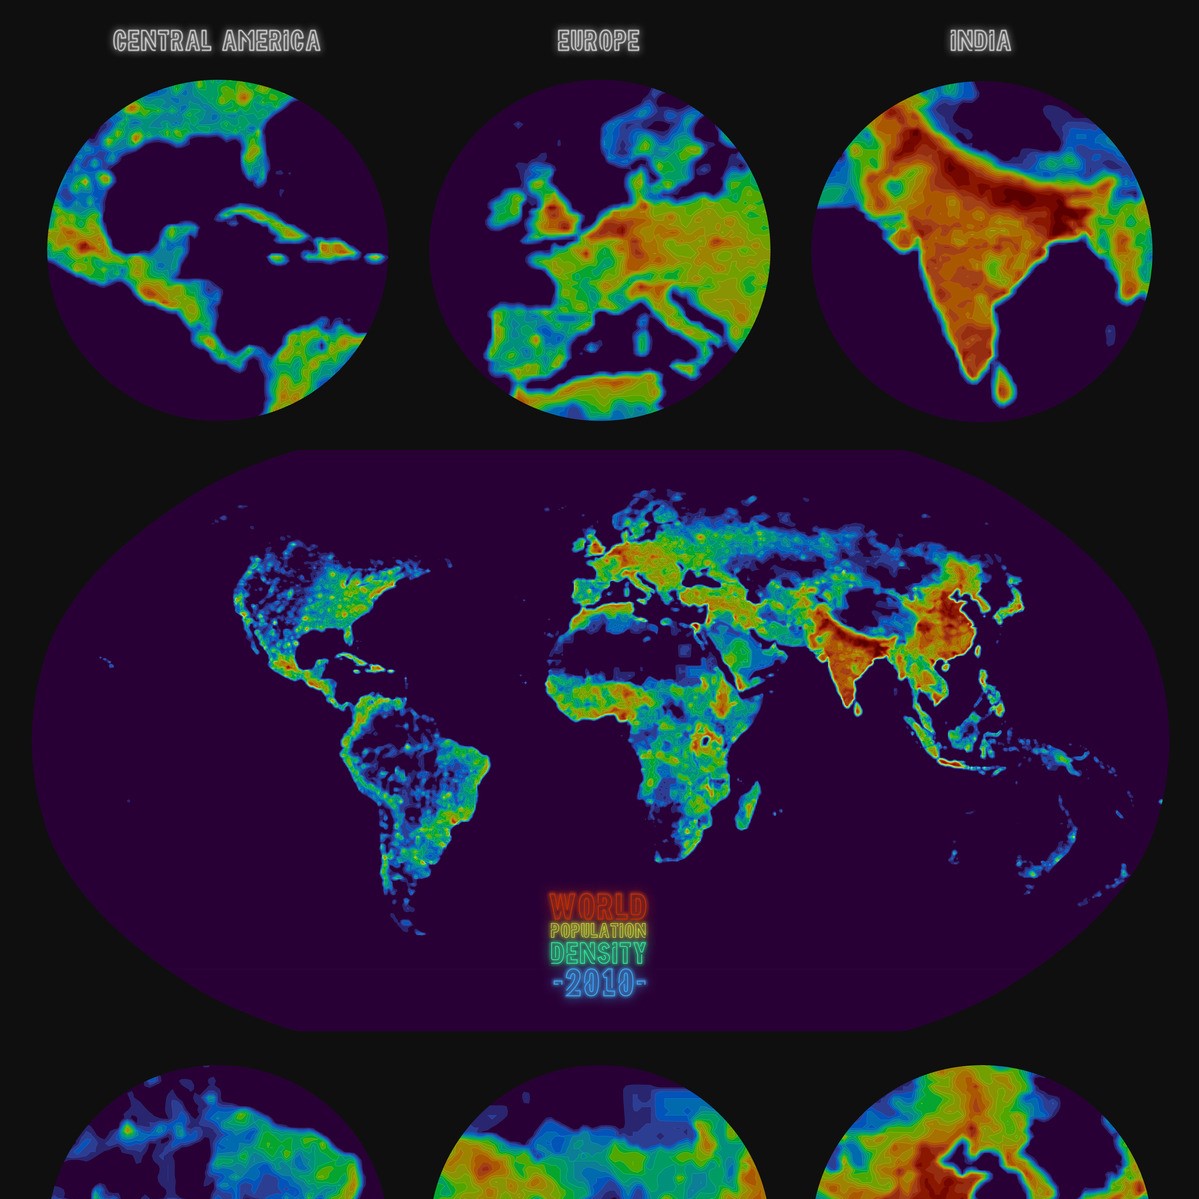
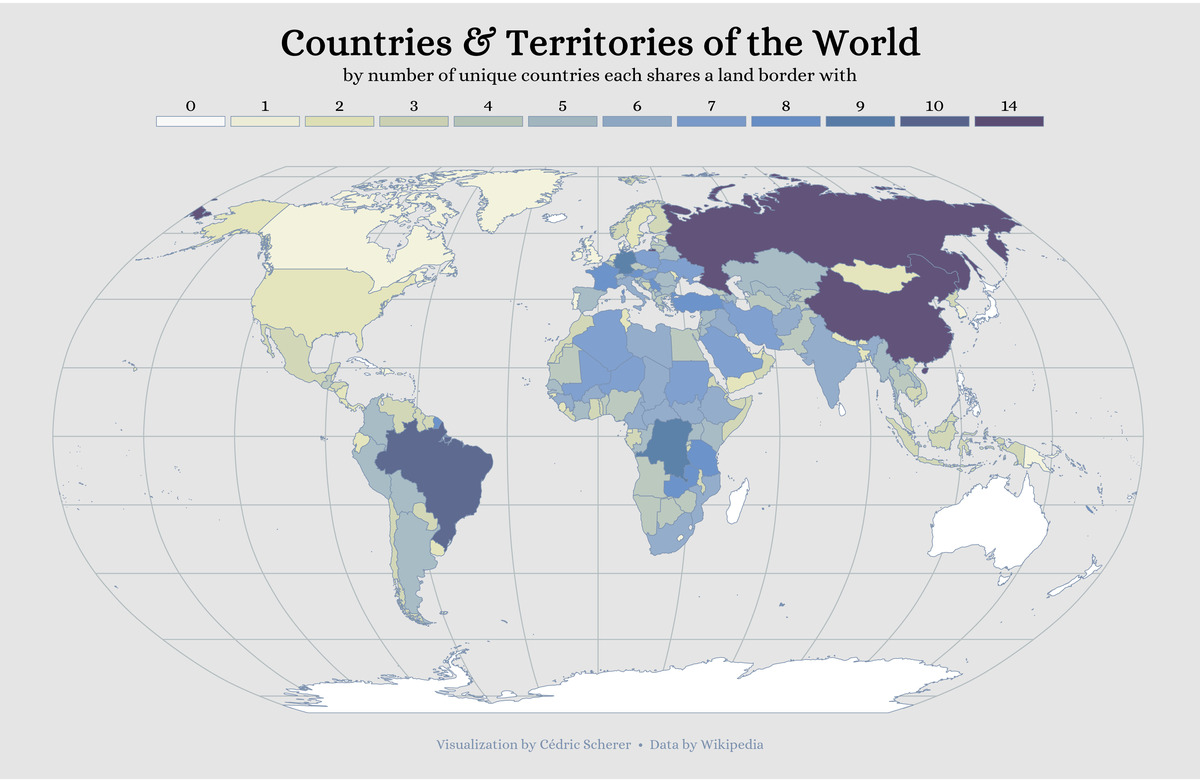
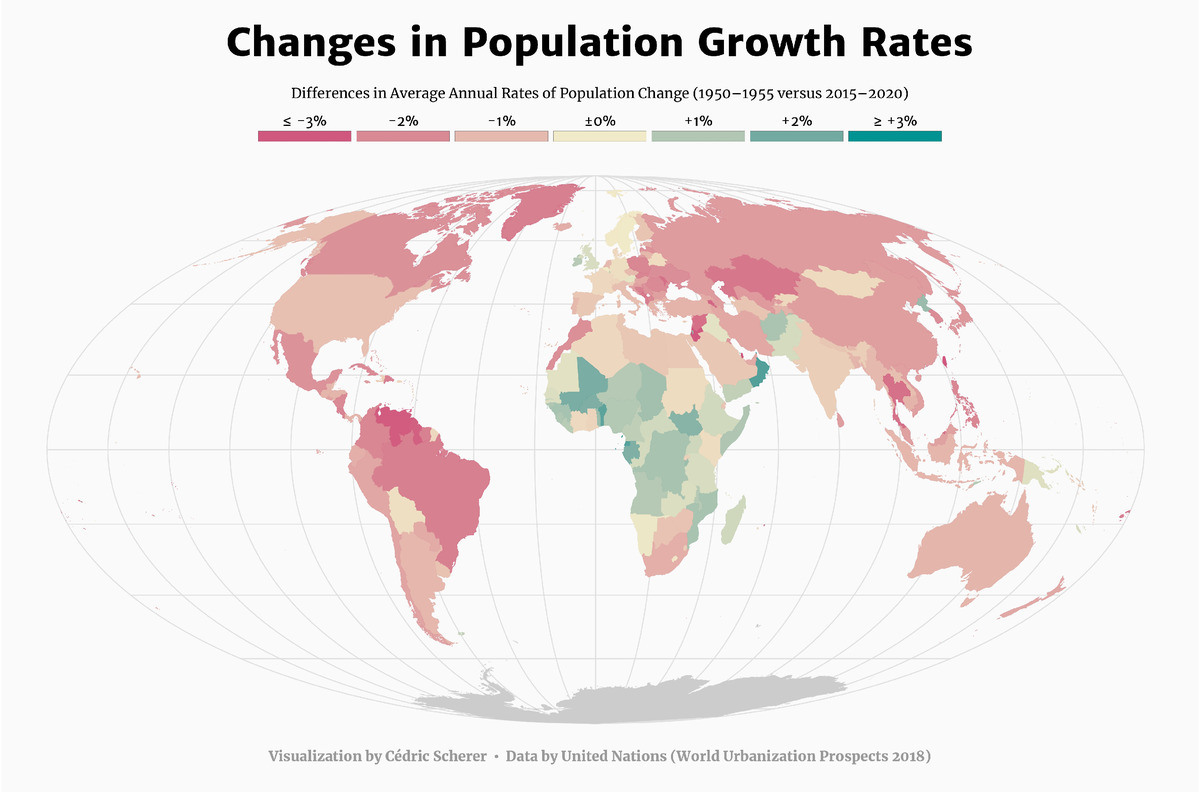
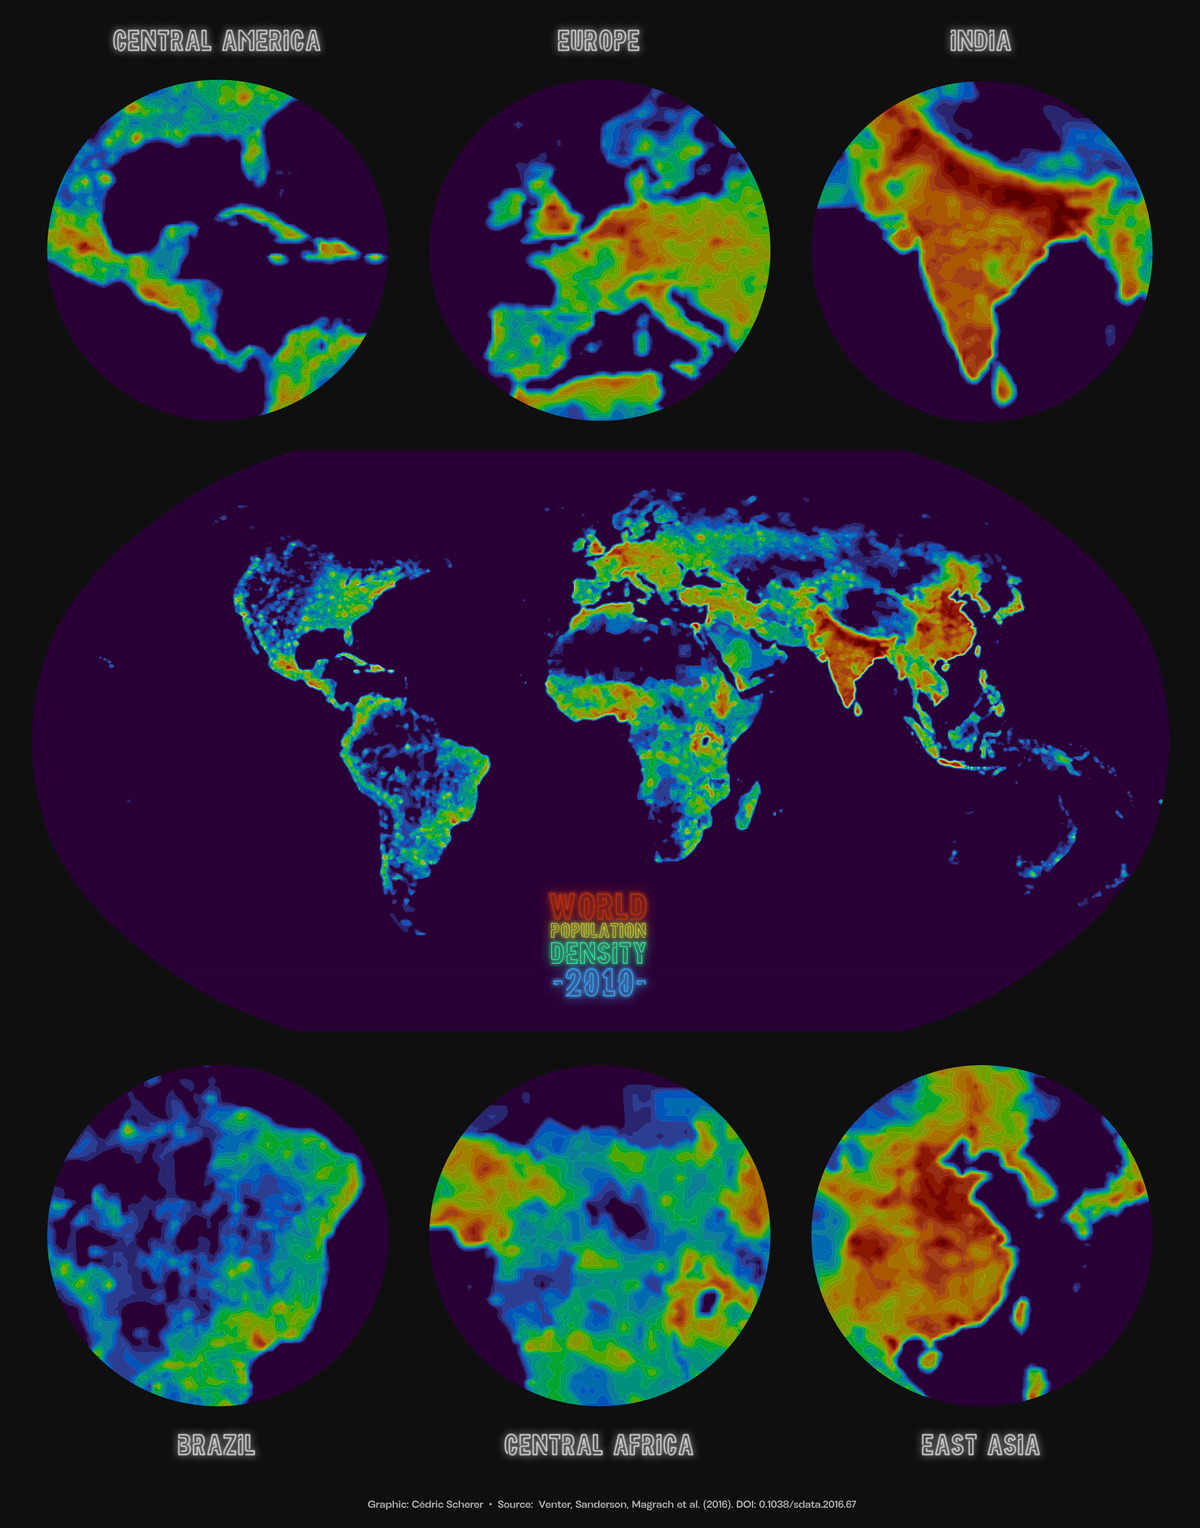
MapChallenge 2021 Day 12 Population World Contours
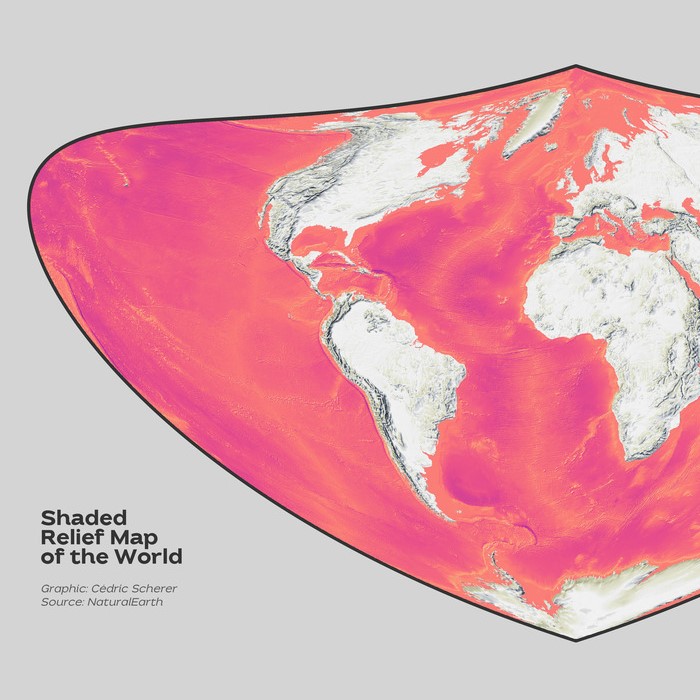
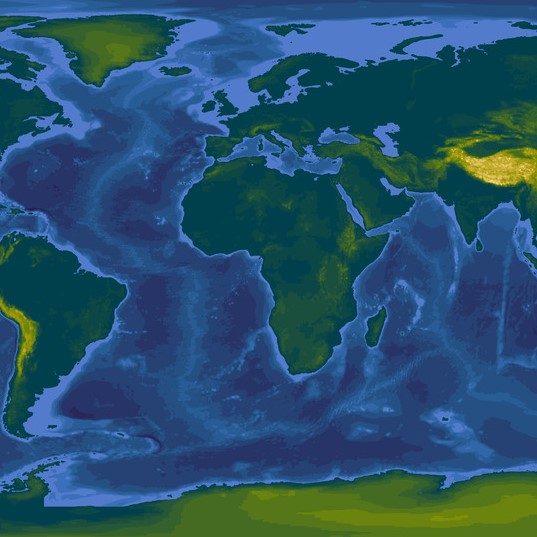
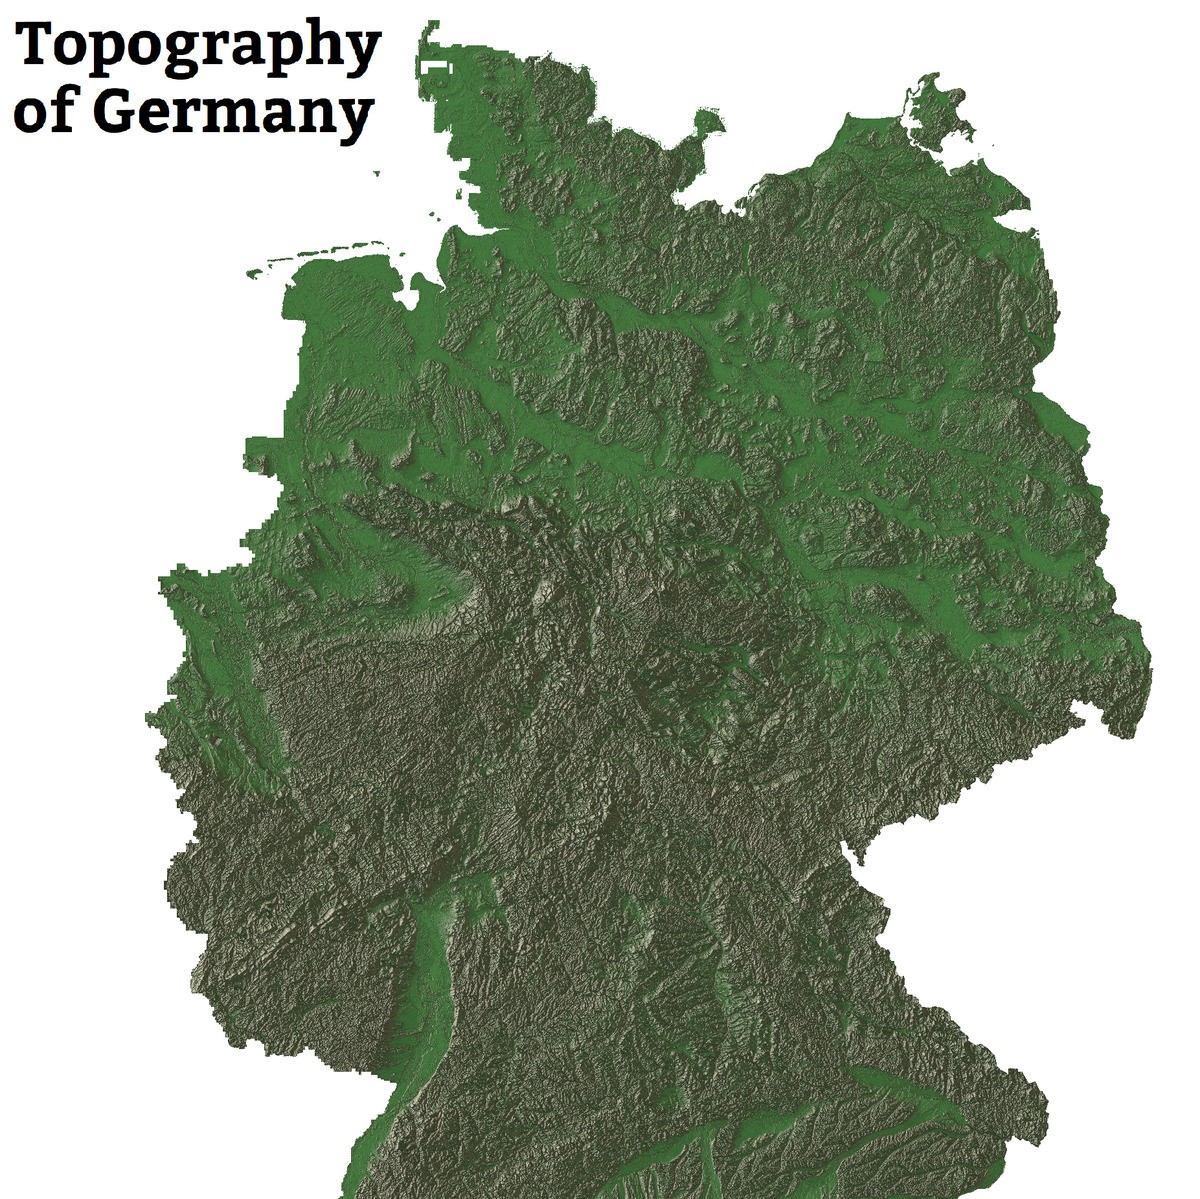
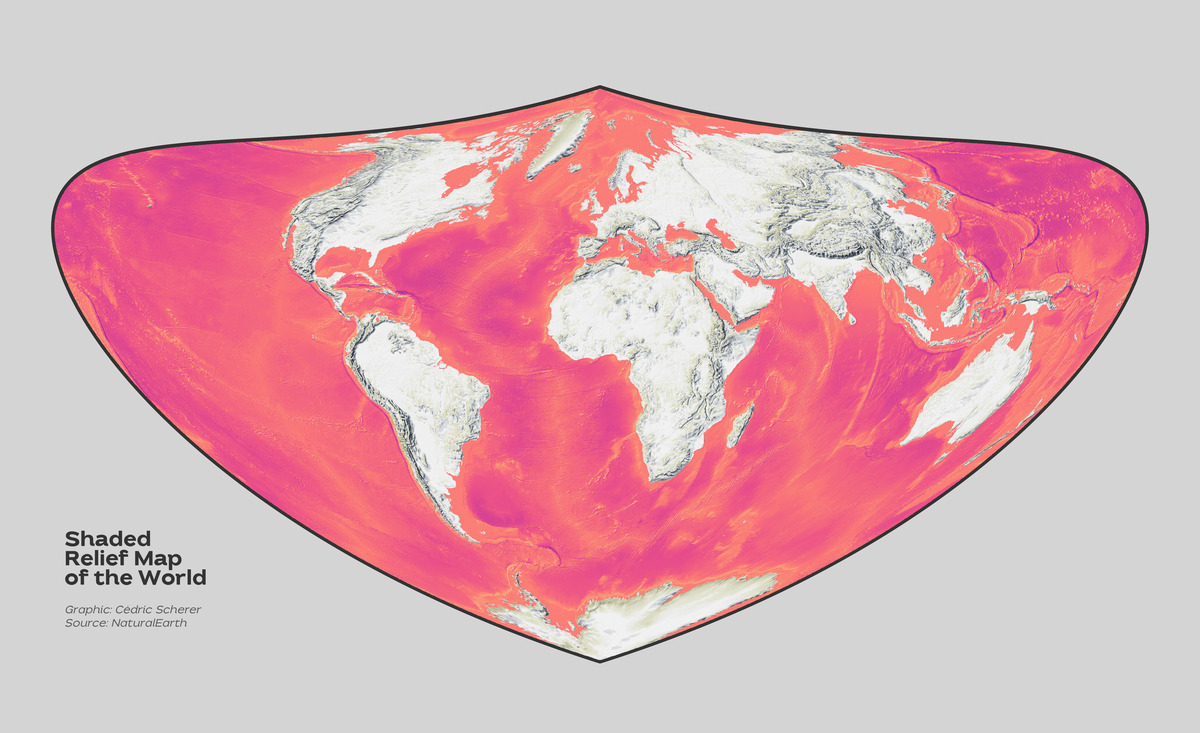
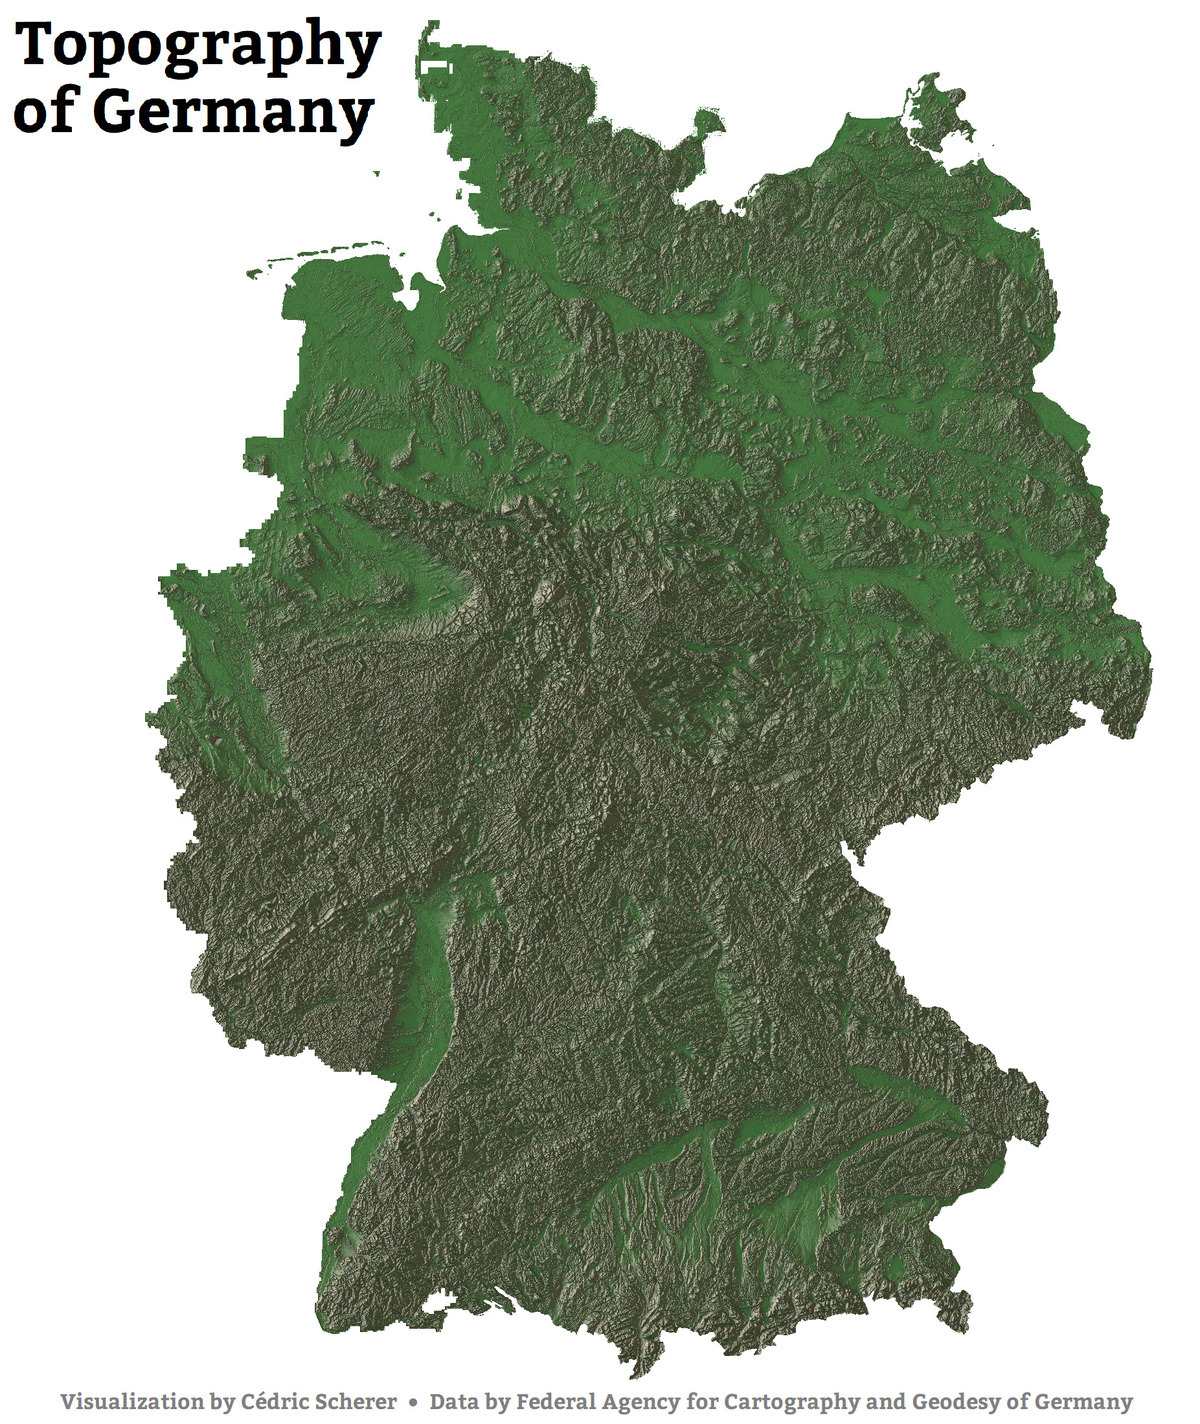
MapChallenge 2021 Day 13 NaturalEarth Relief Bonne Projection
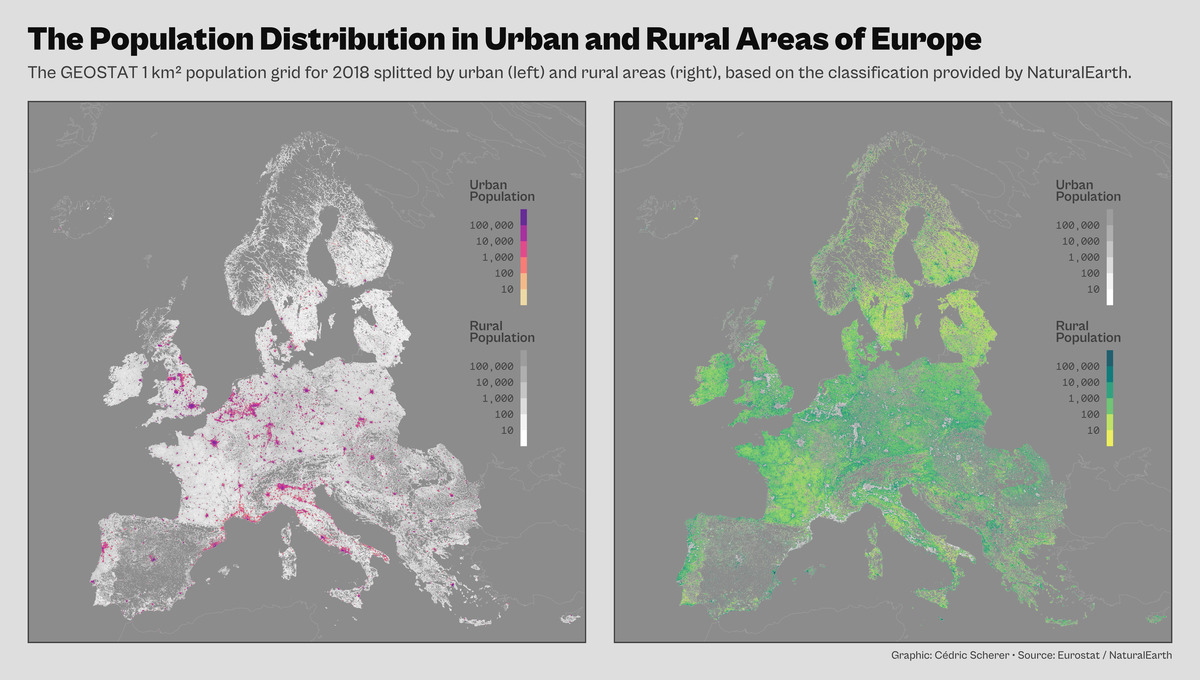
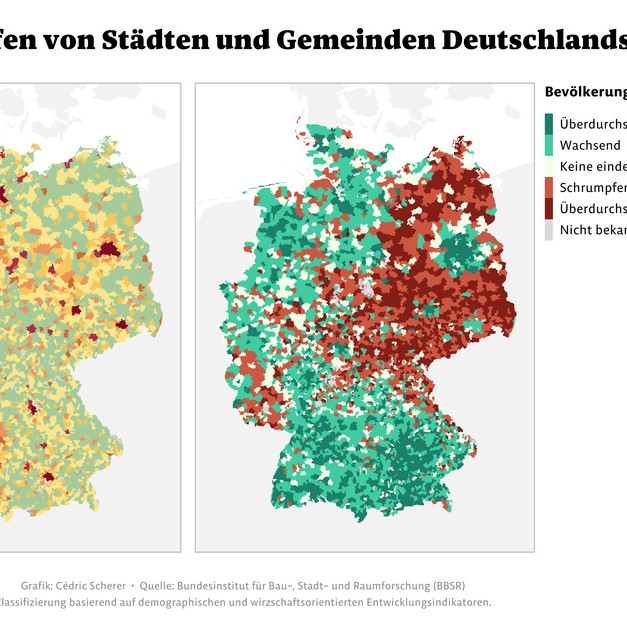
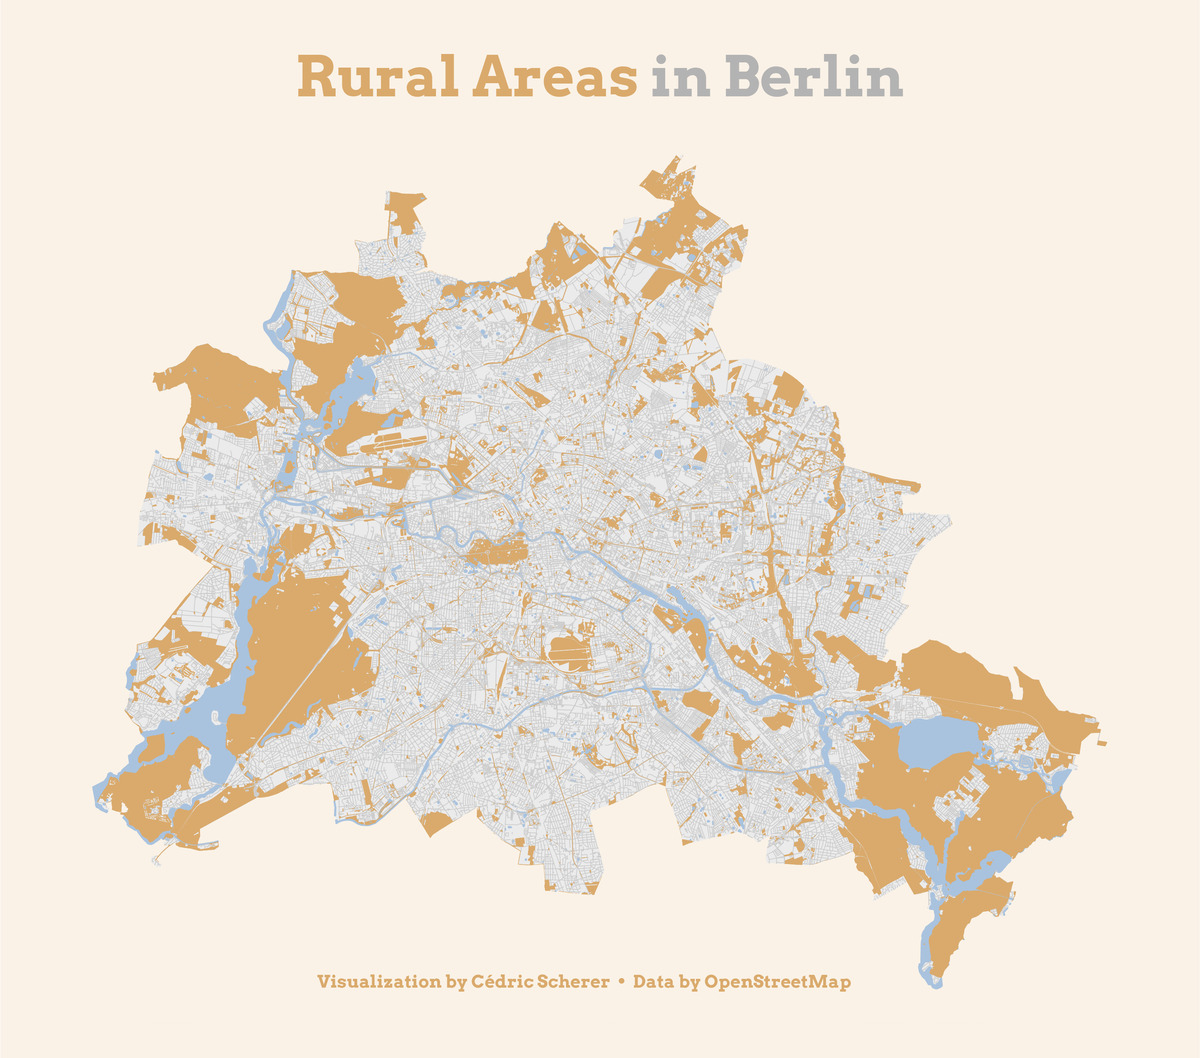
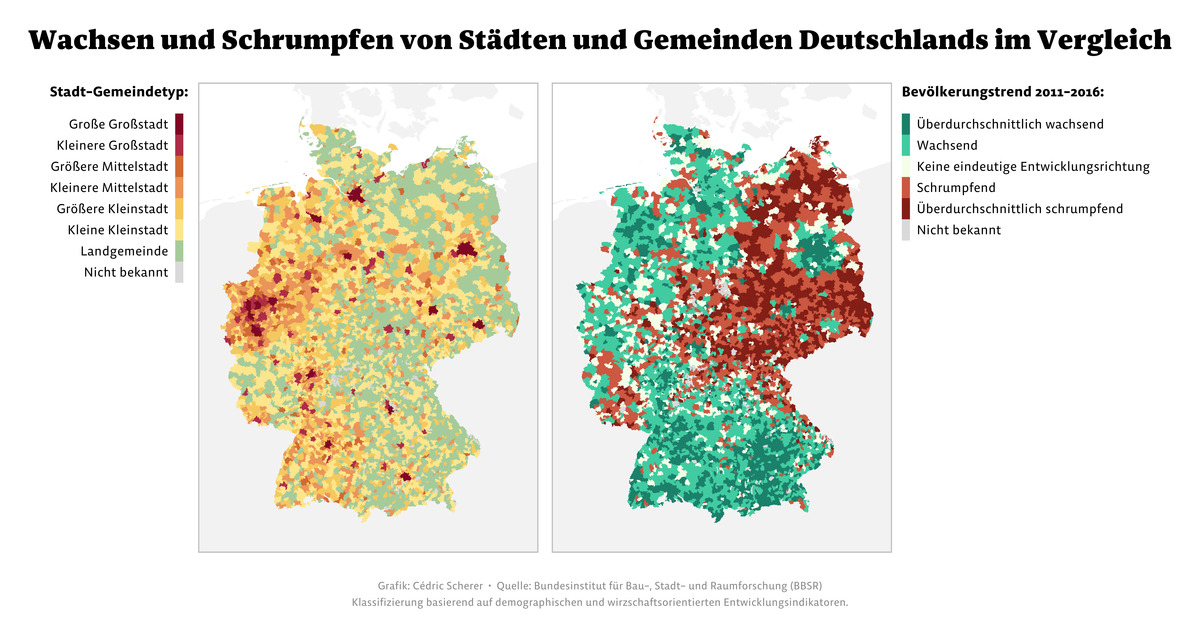
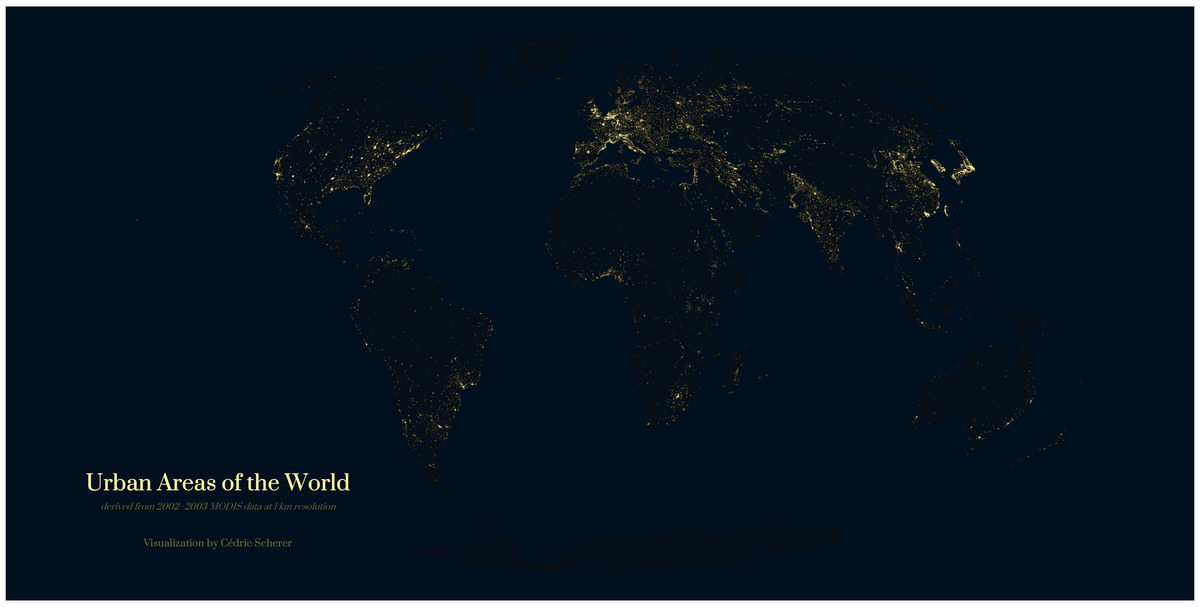
MapChallenge 2021 Day 16 Urban Rural Municipalities of Germany
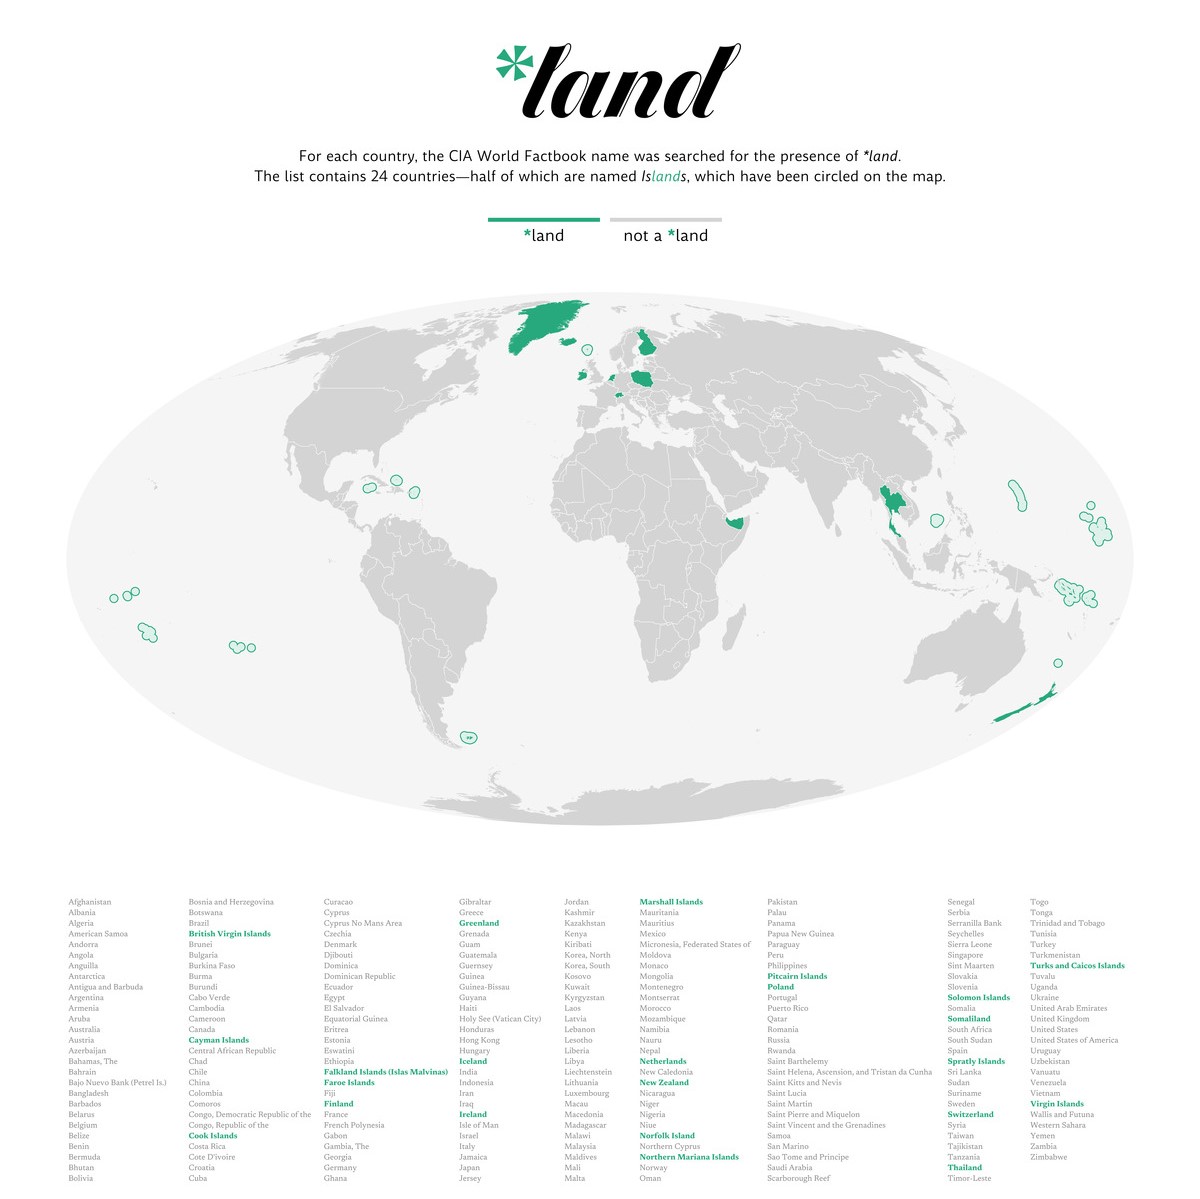
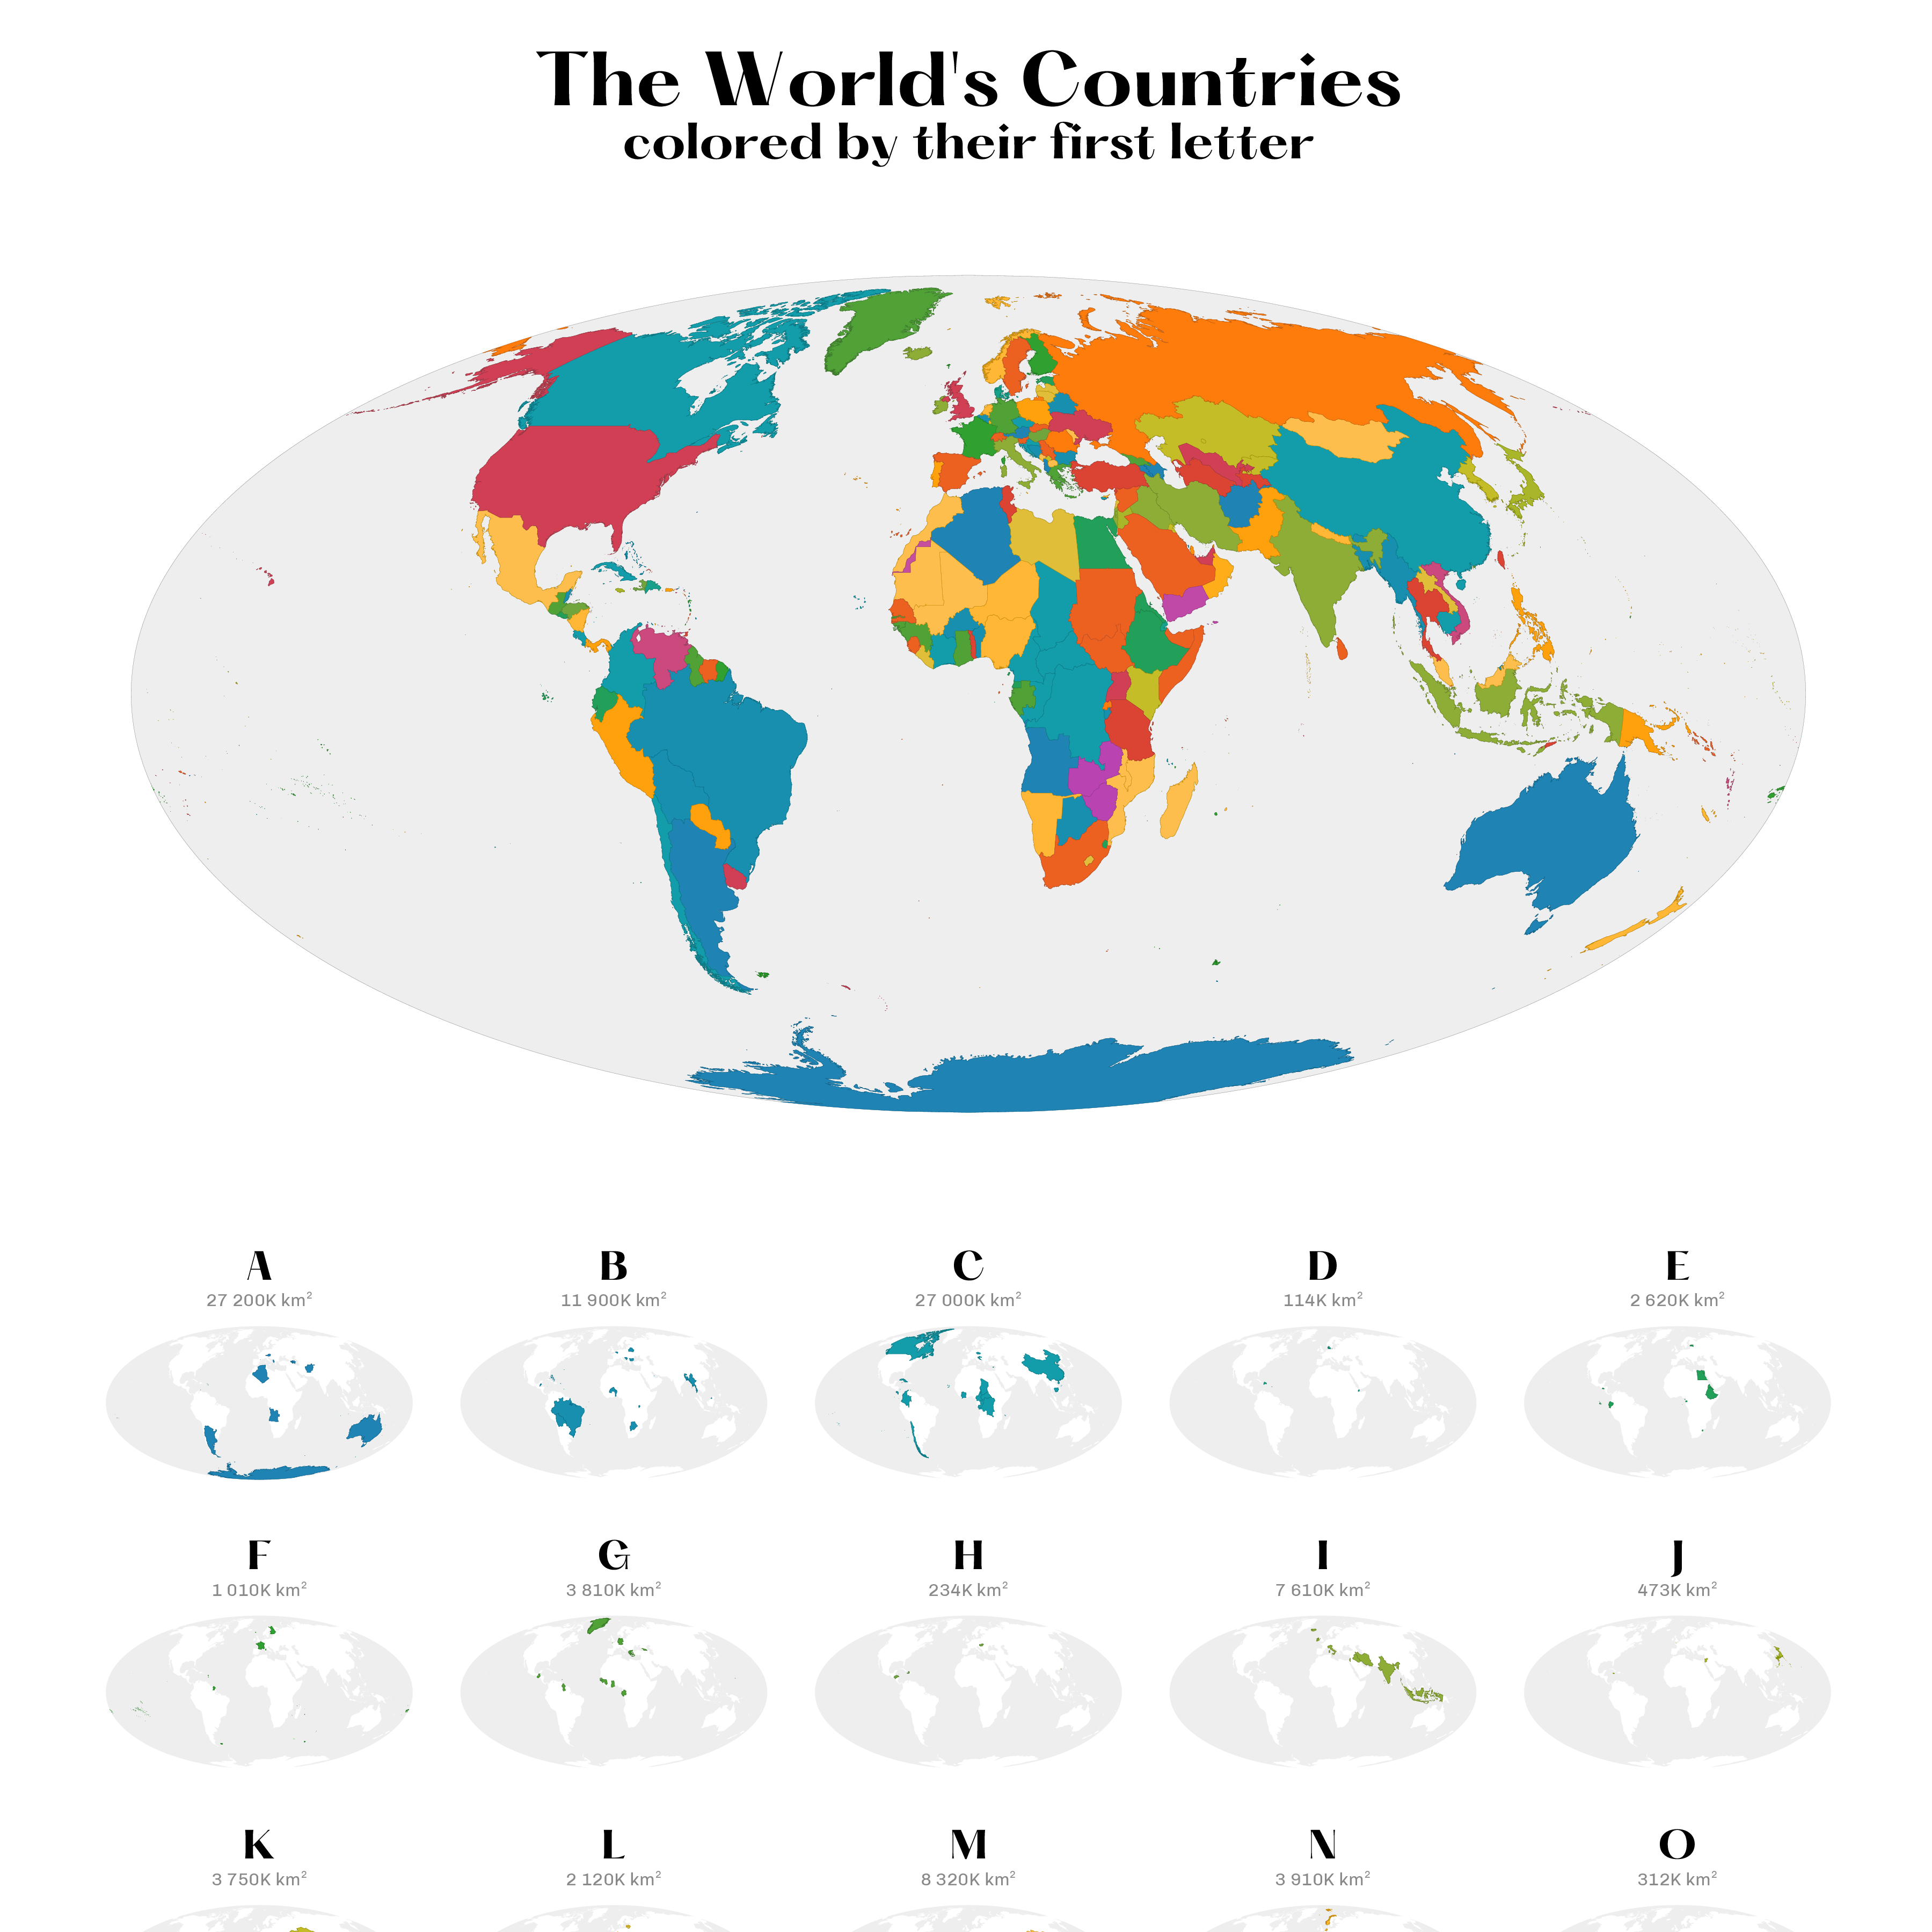
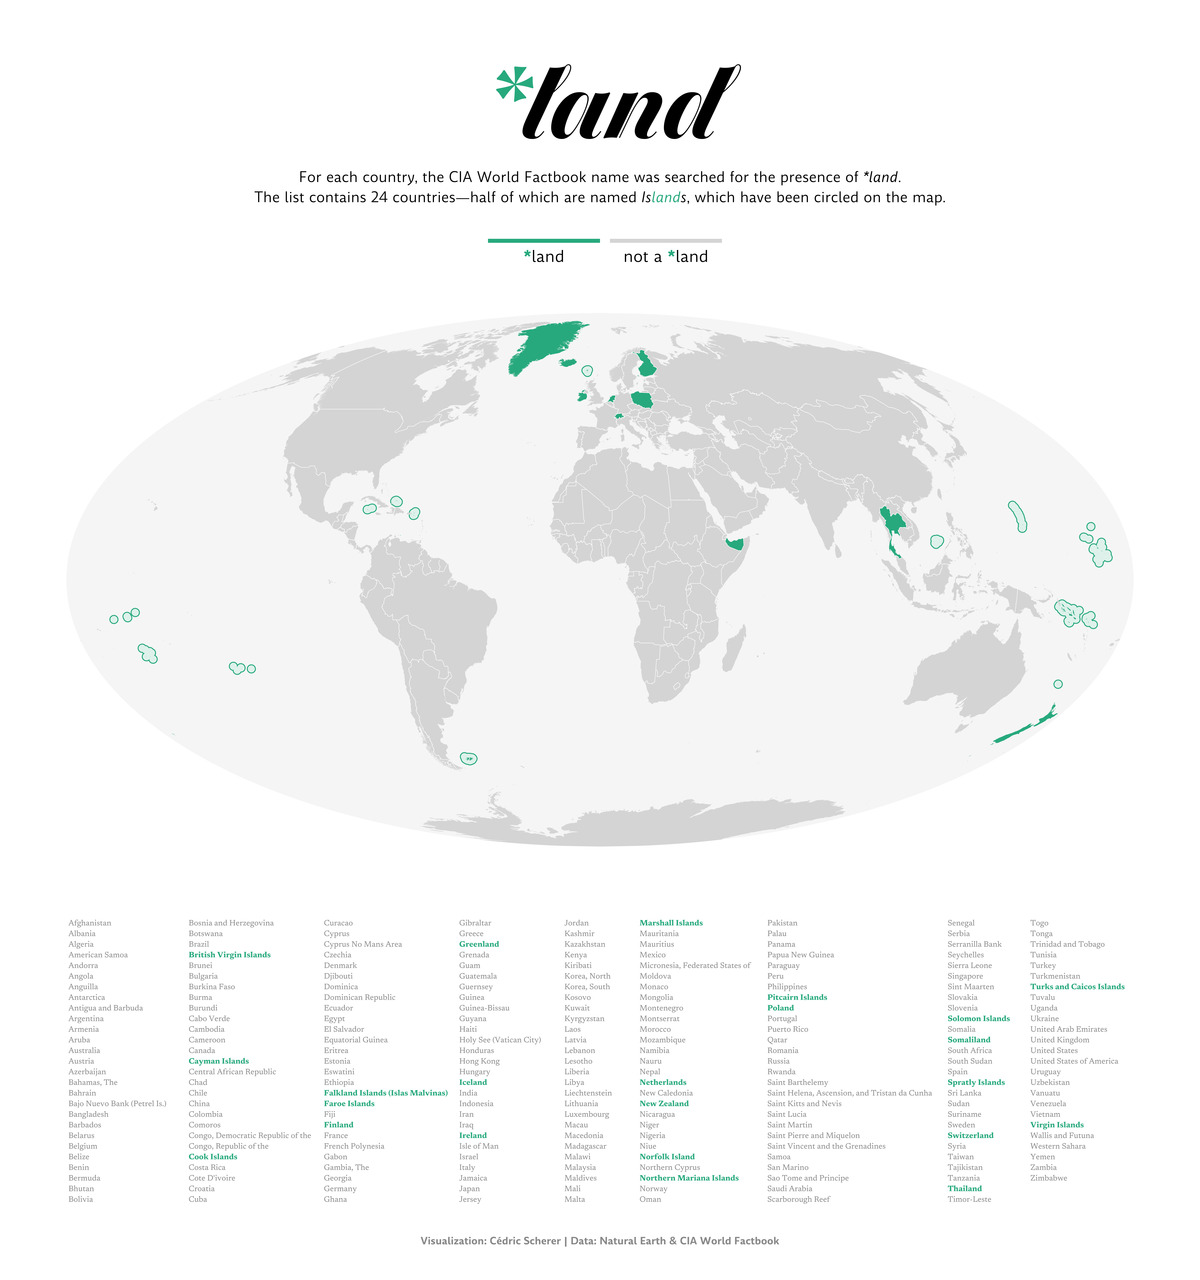
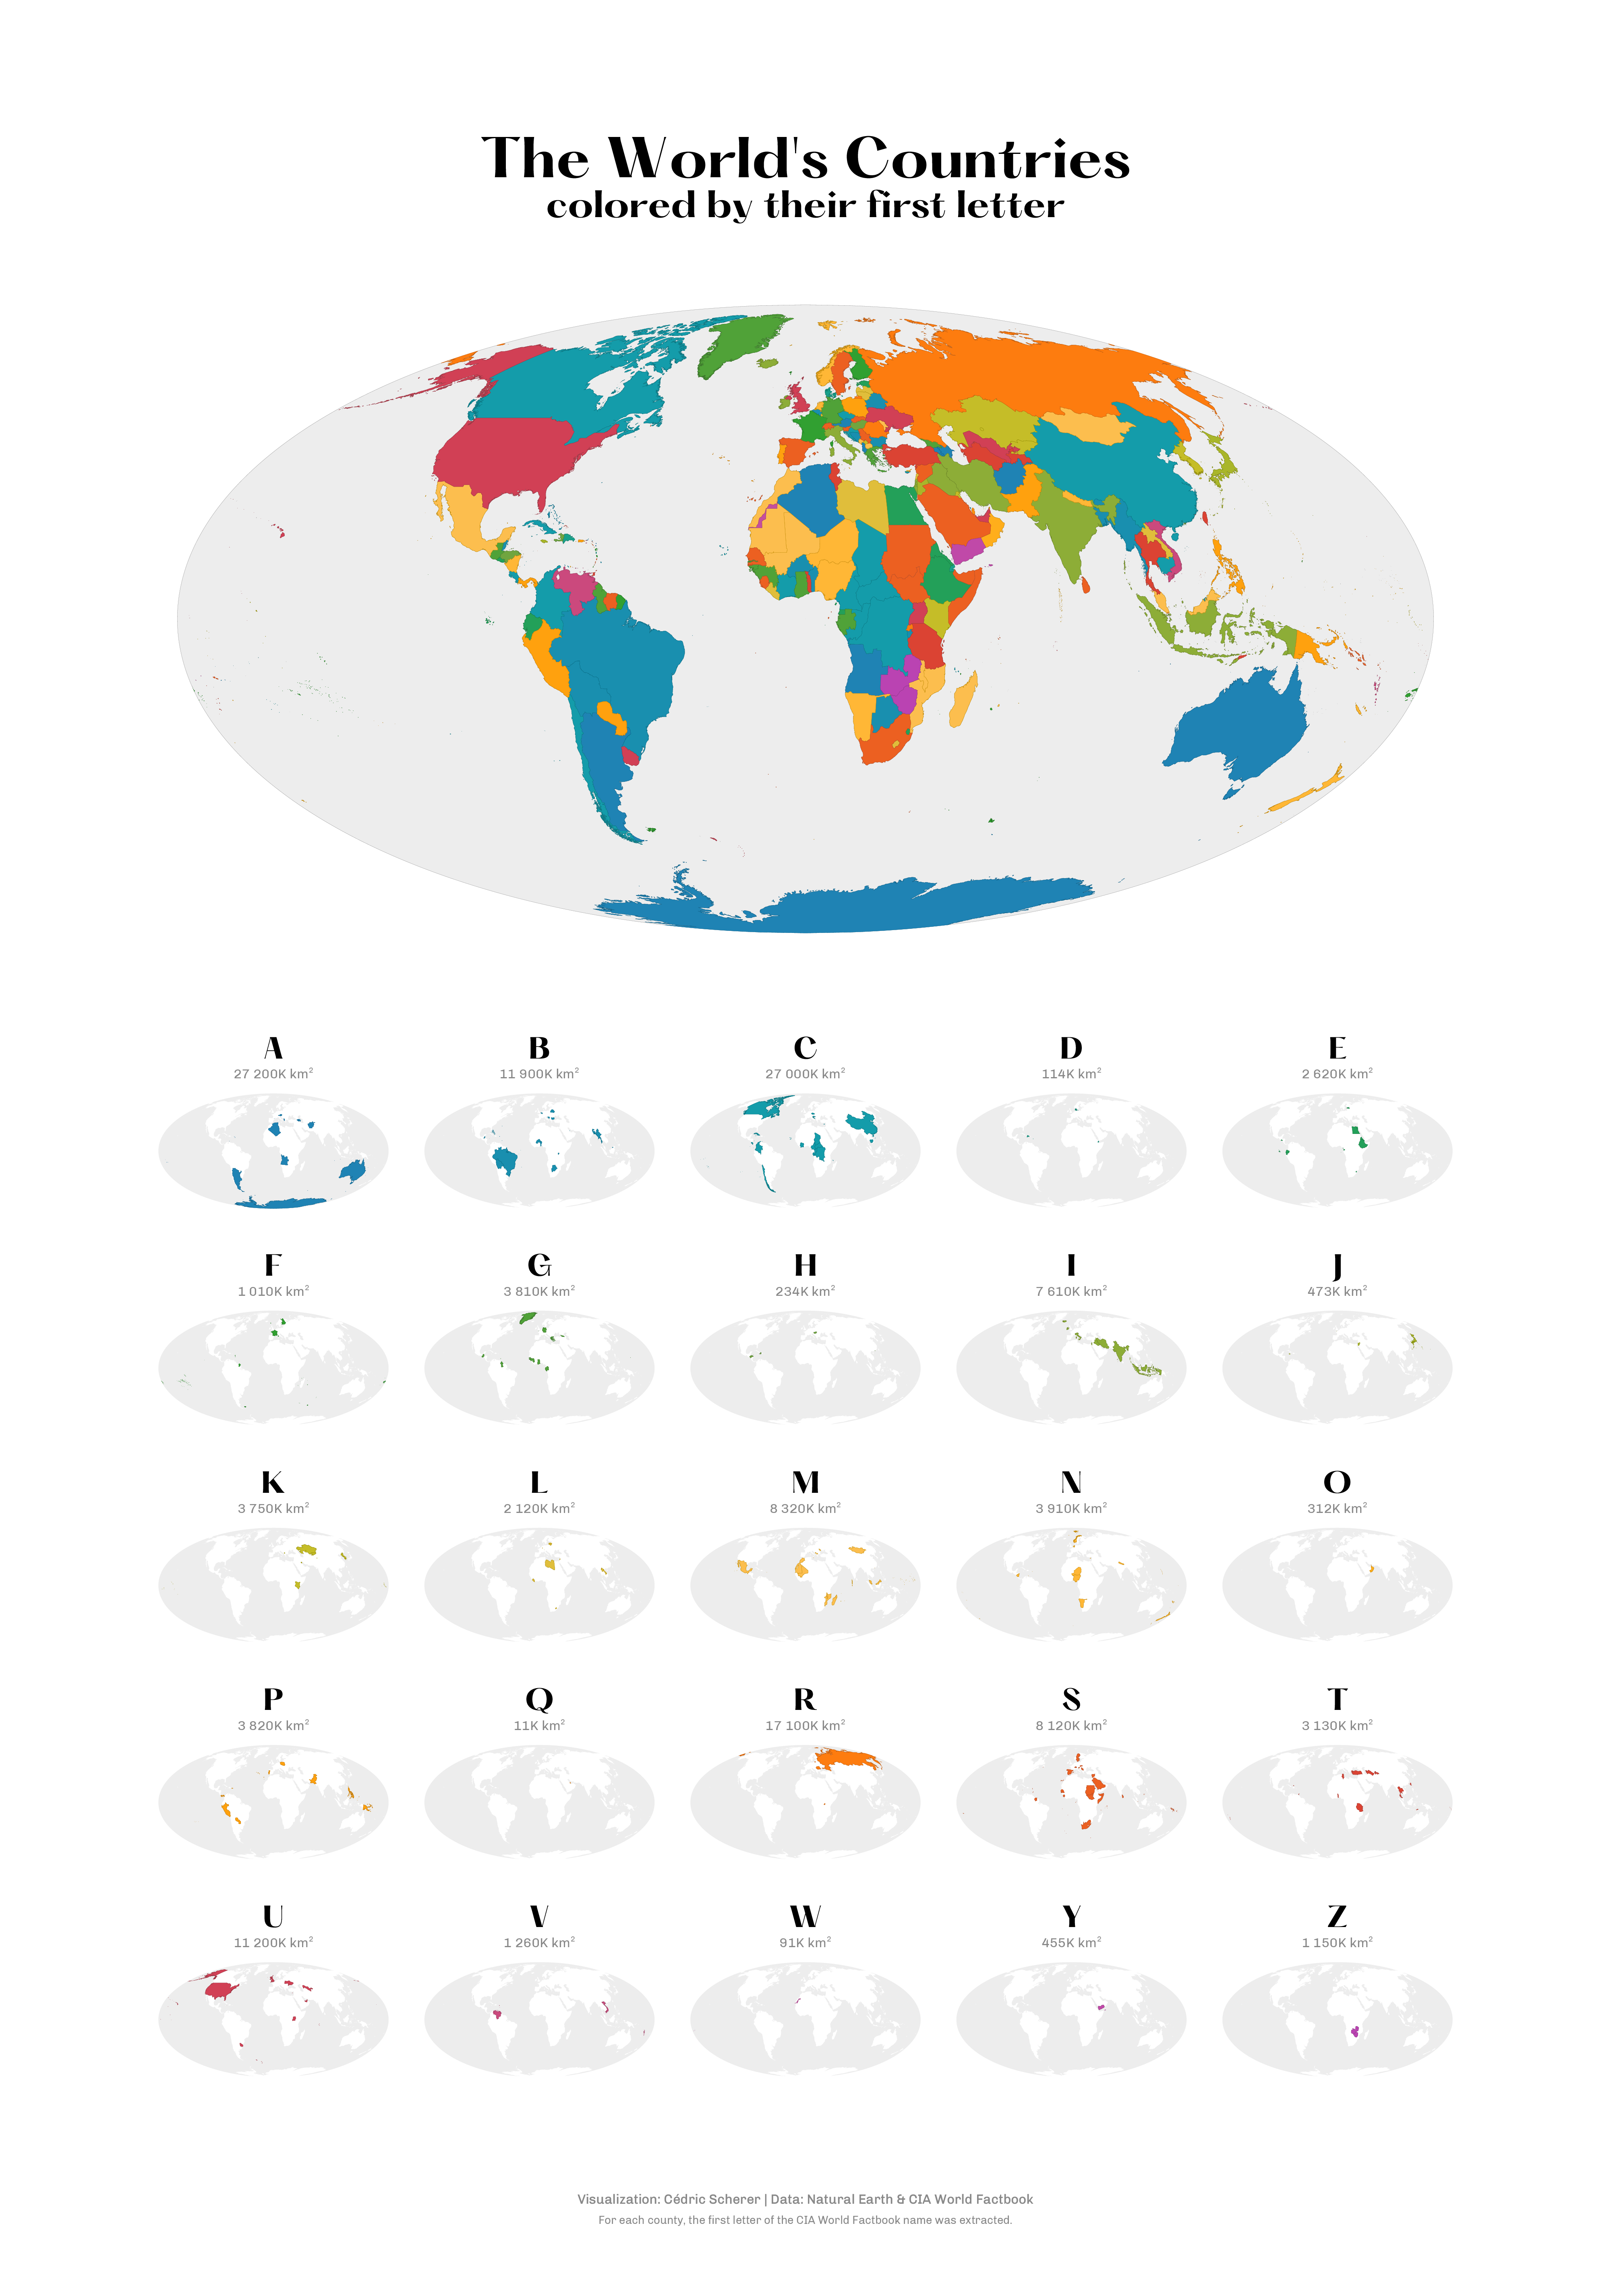
MapChallenge 2021 Day 17 Land Countries named Land
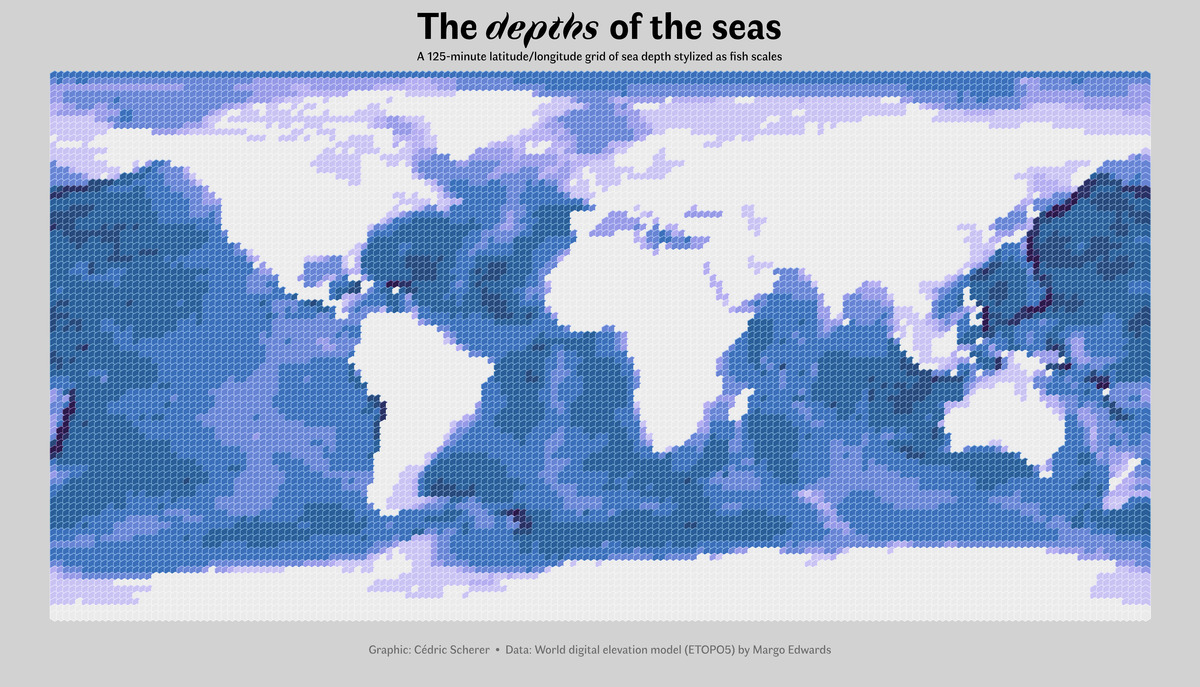
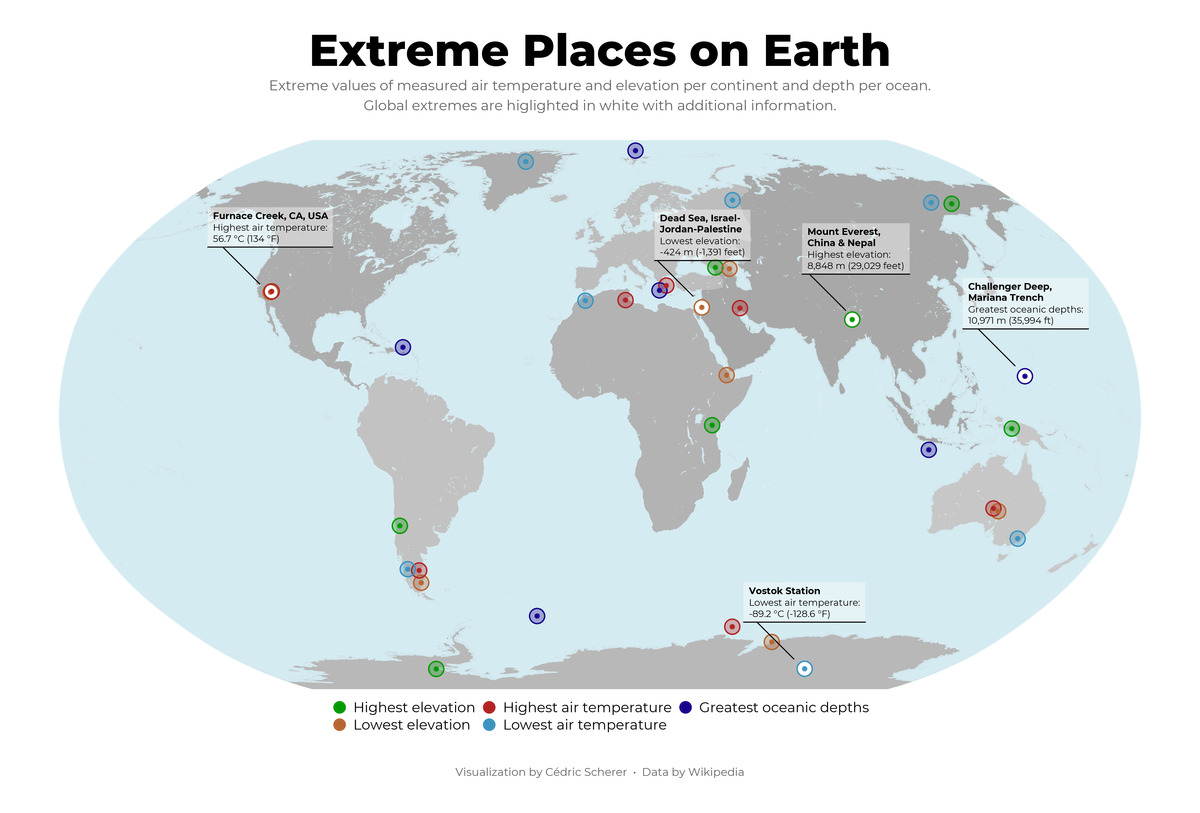
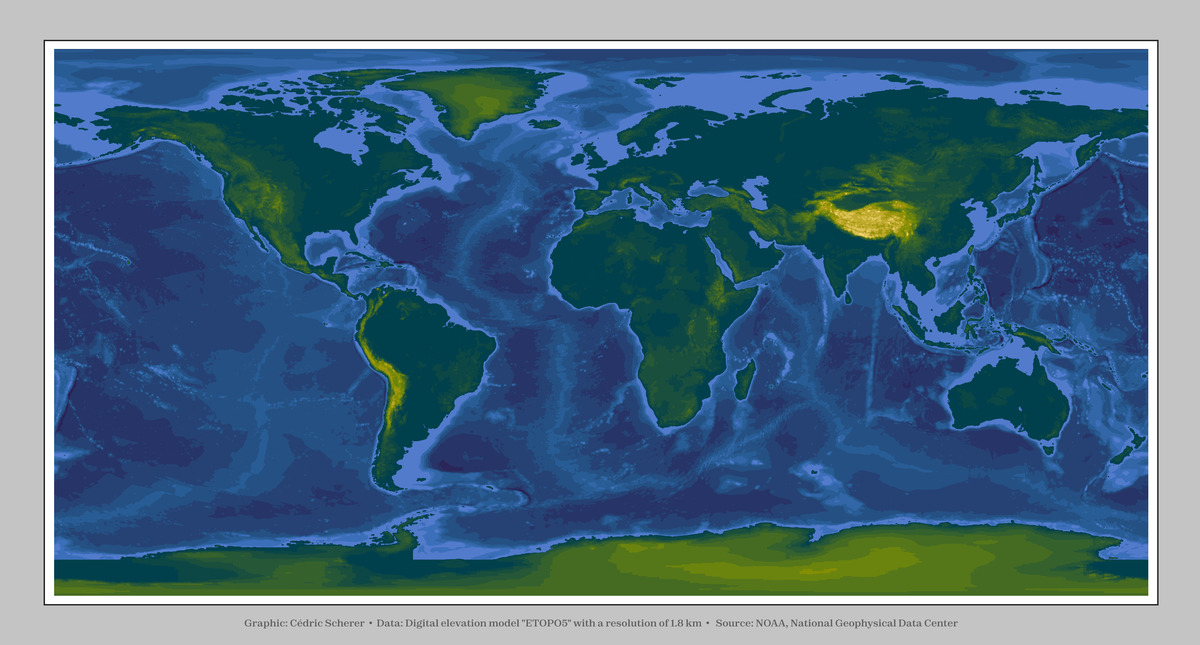
MapChallenge 2021 Day 18 Water Ocean Depths
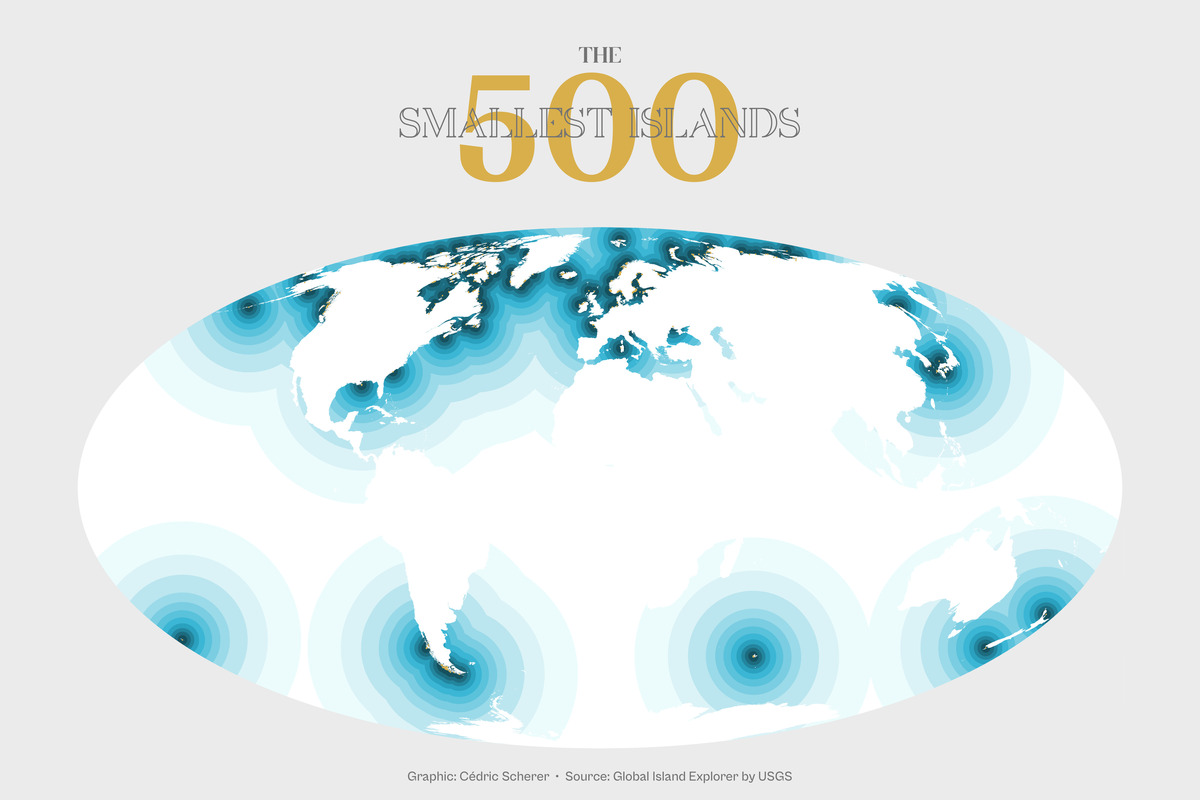
MapChallenge 2021 Day 19 Islands The Smallest 500
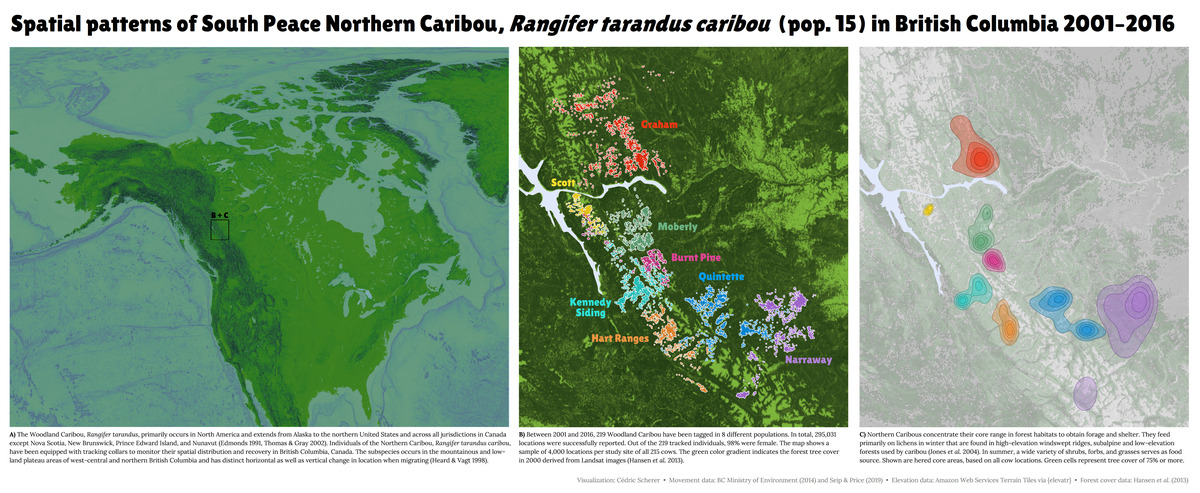
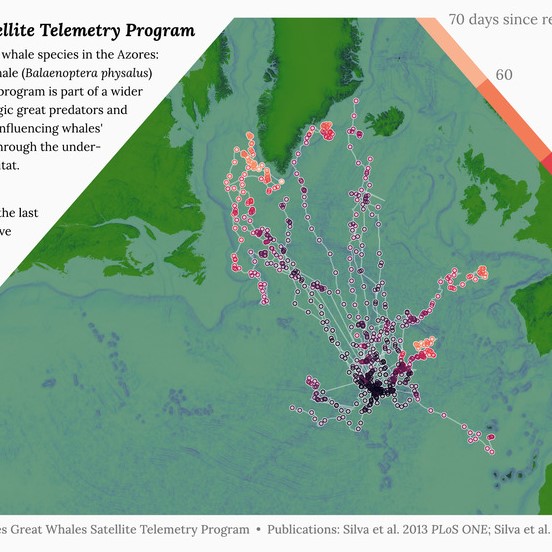
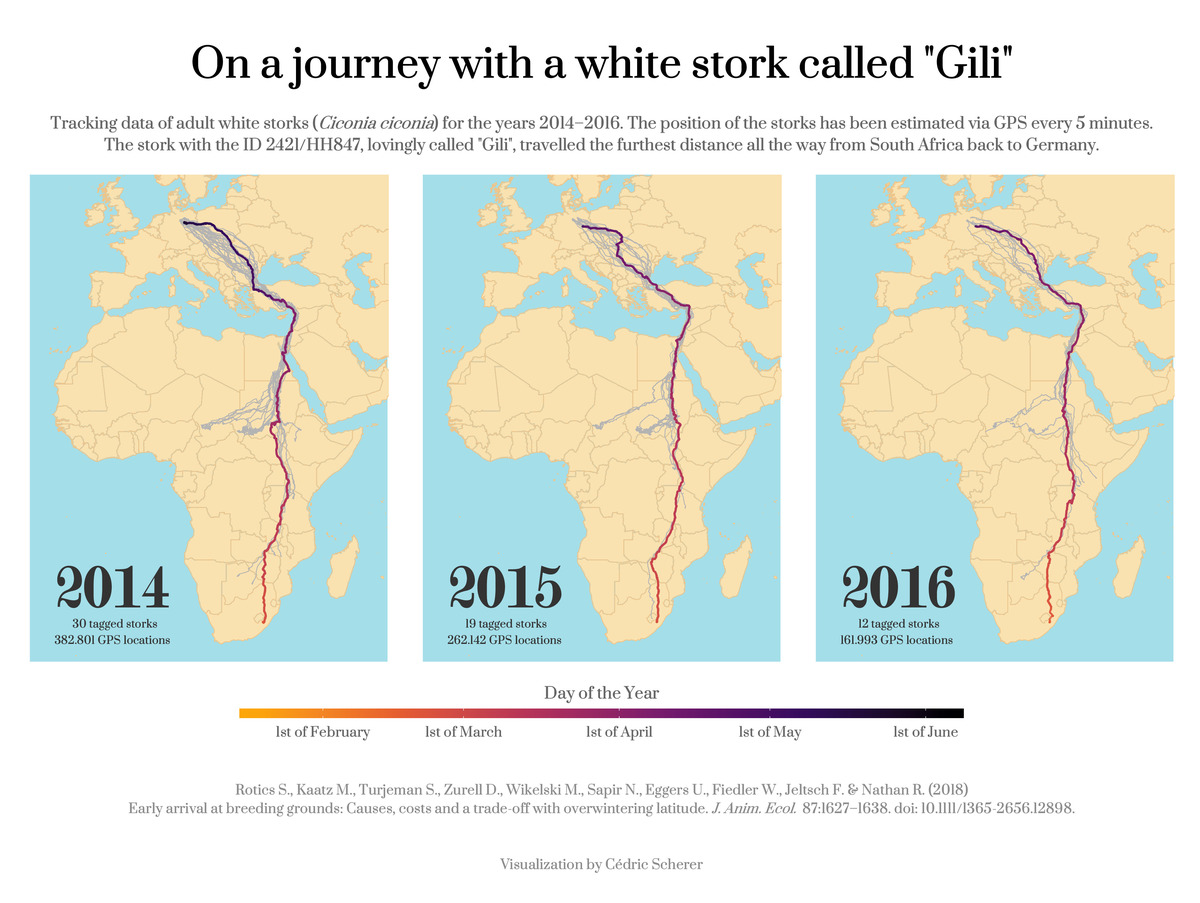
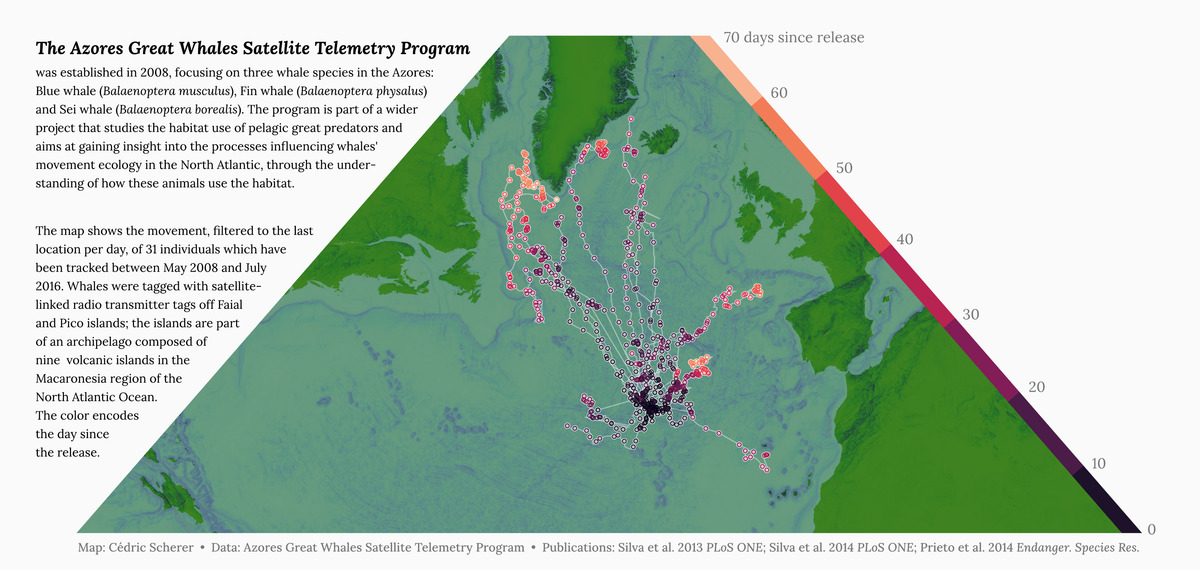
MapChallenge 2021 Day 20 Movement Great Whales
MapChallenge 2021 Day 21 Elevation World Contours
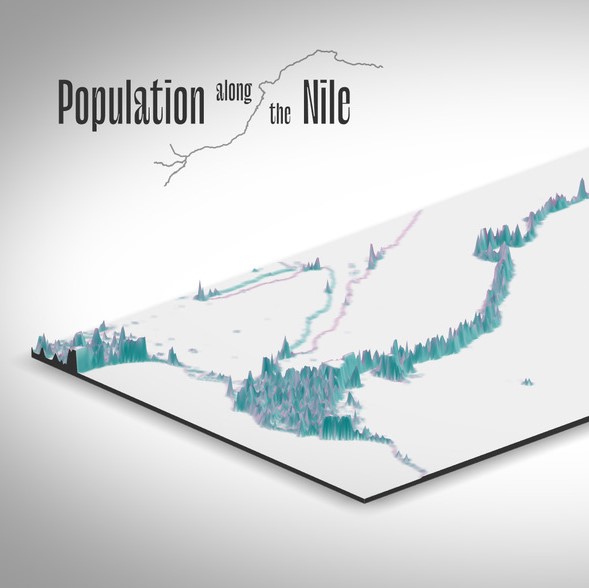
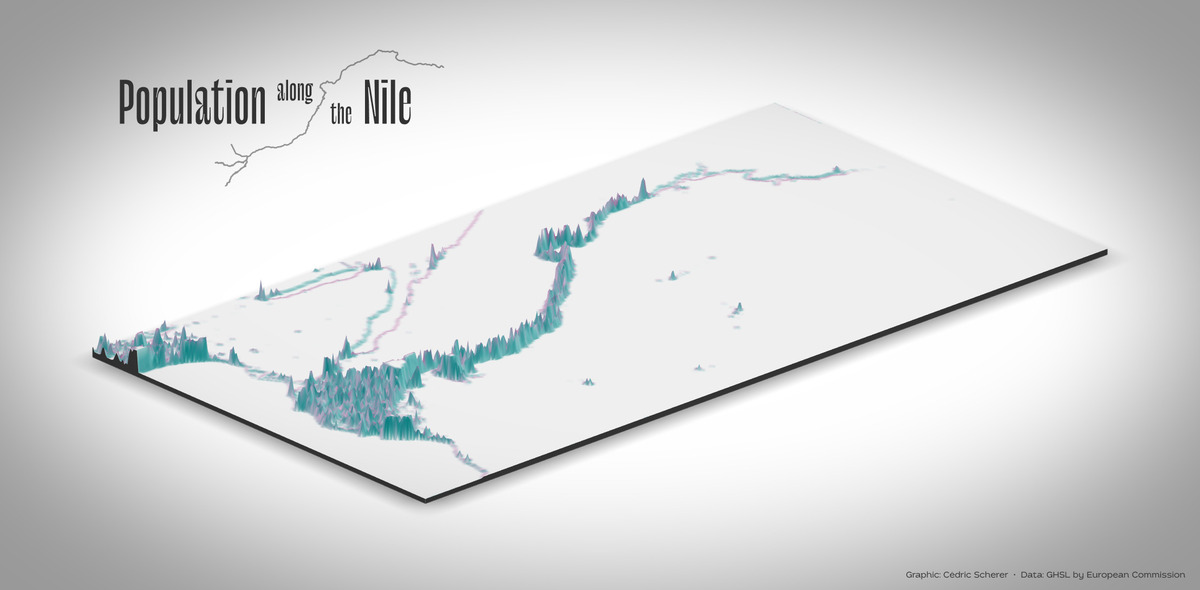
MapChallenge 2021 Day 23 GHSL Data Nile Population
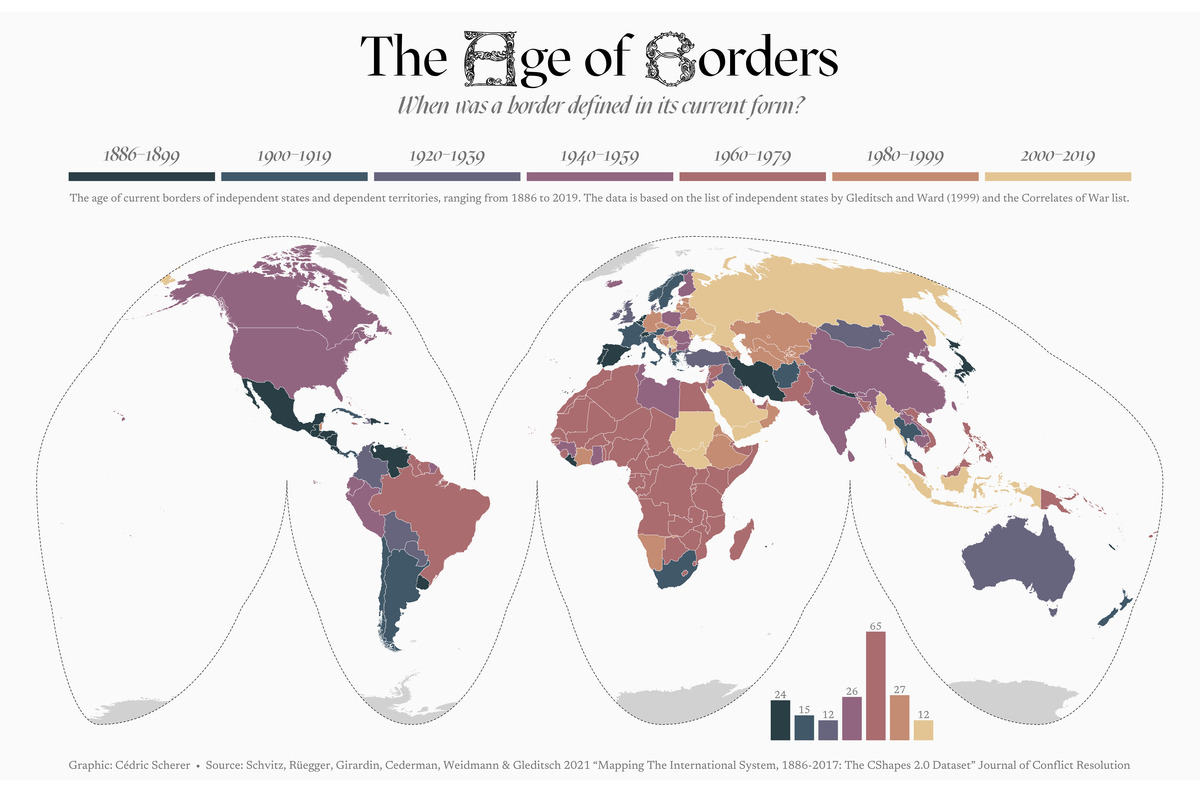
MapChallenge 2021 Day 24 Historical Country Borders by Age
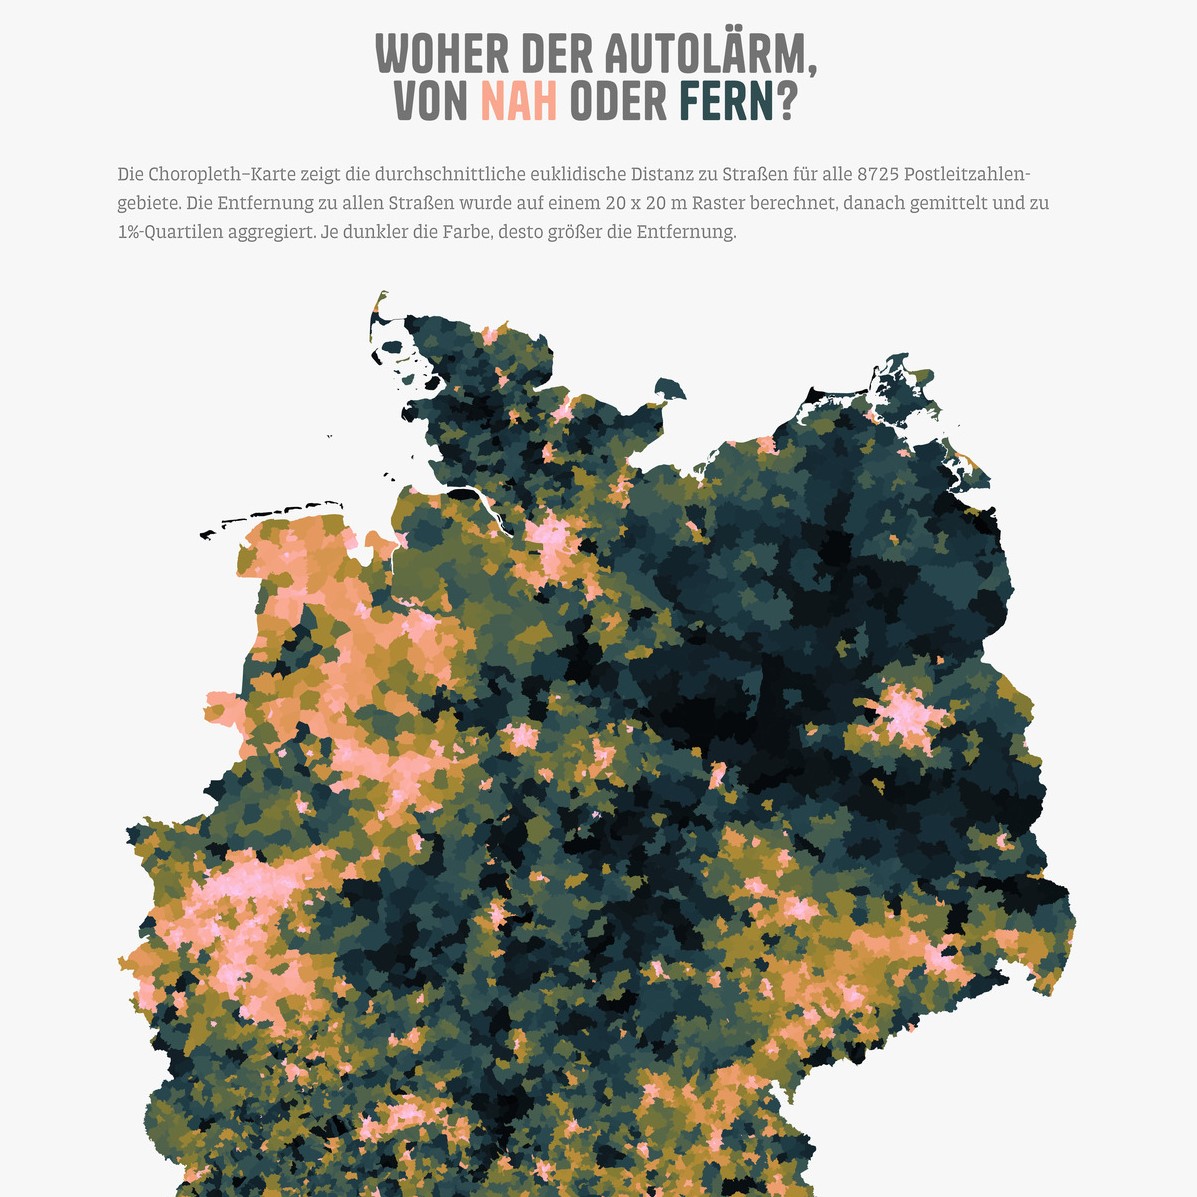
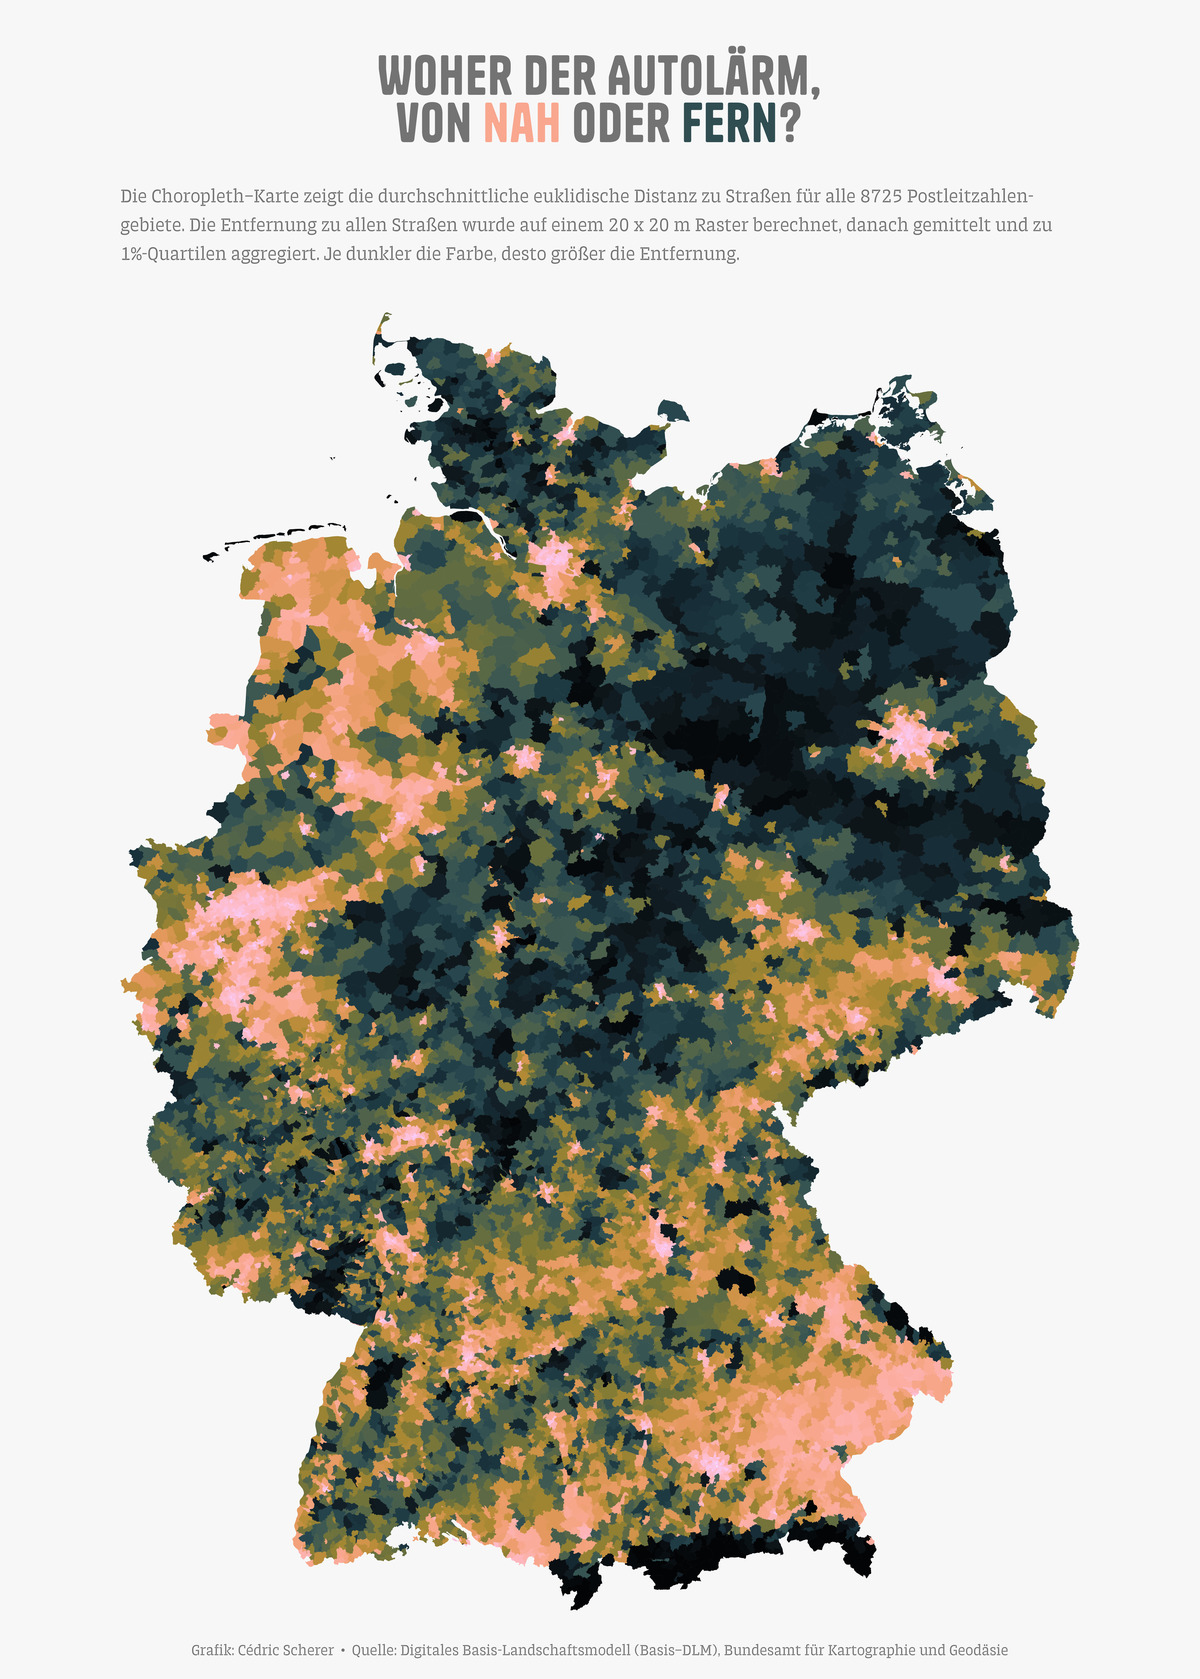
MapChallenge 2021 Day 26 Choropleth Distance to Roads in Germany
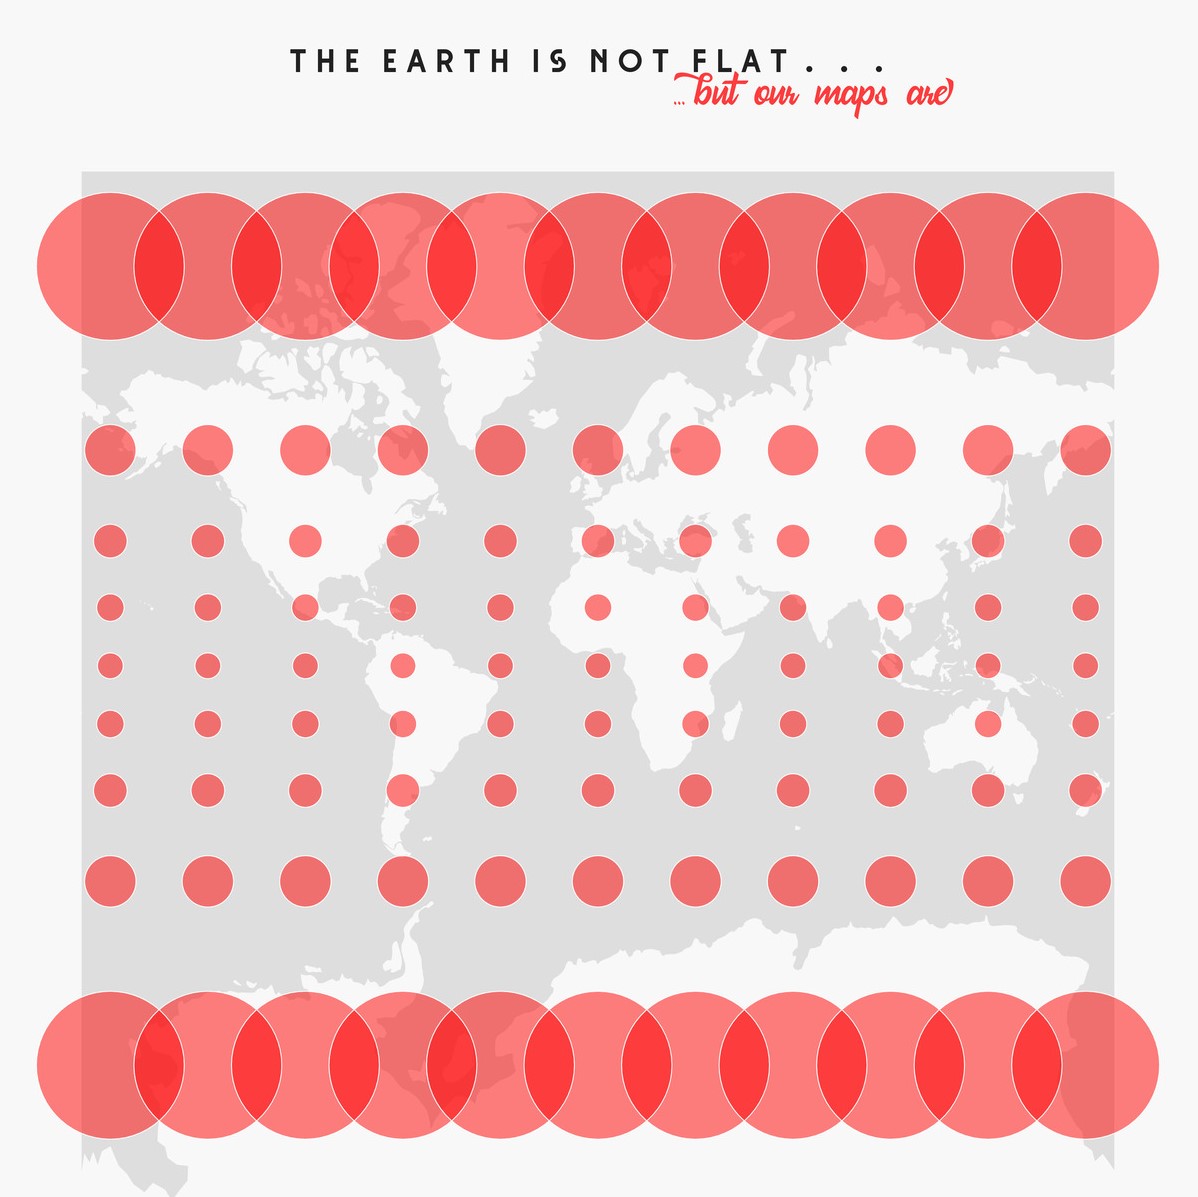
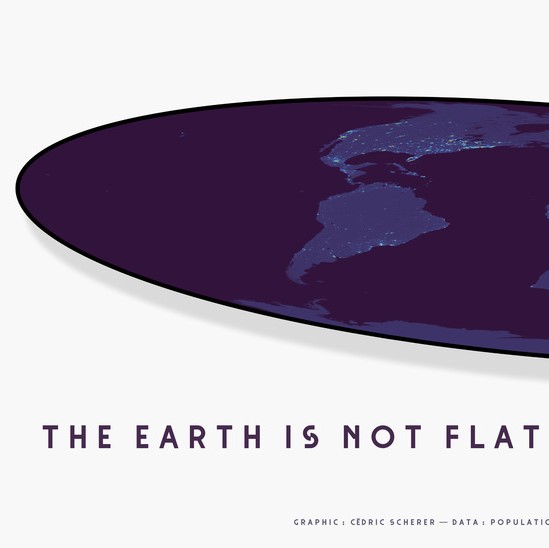
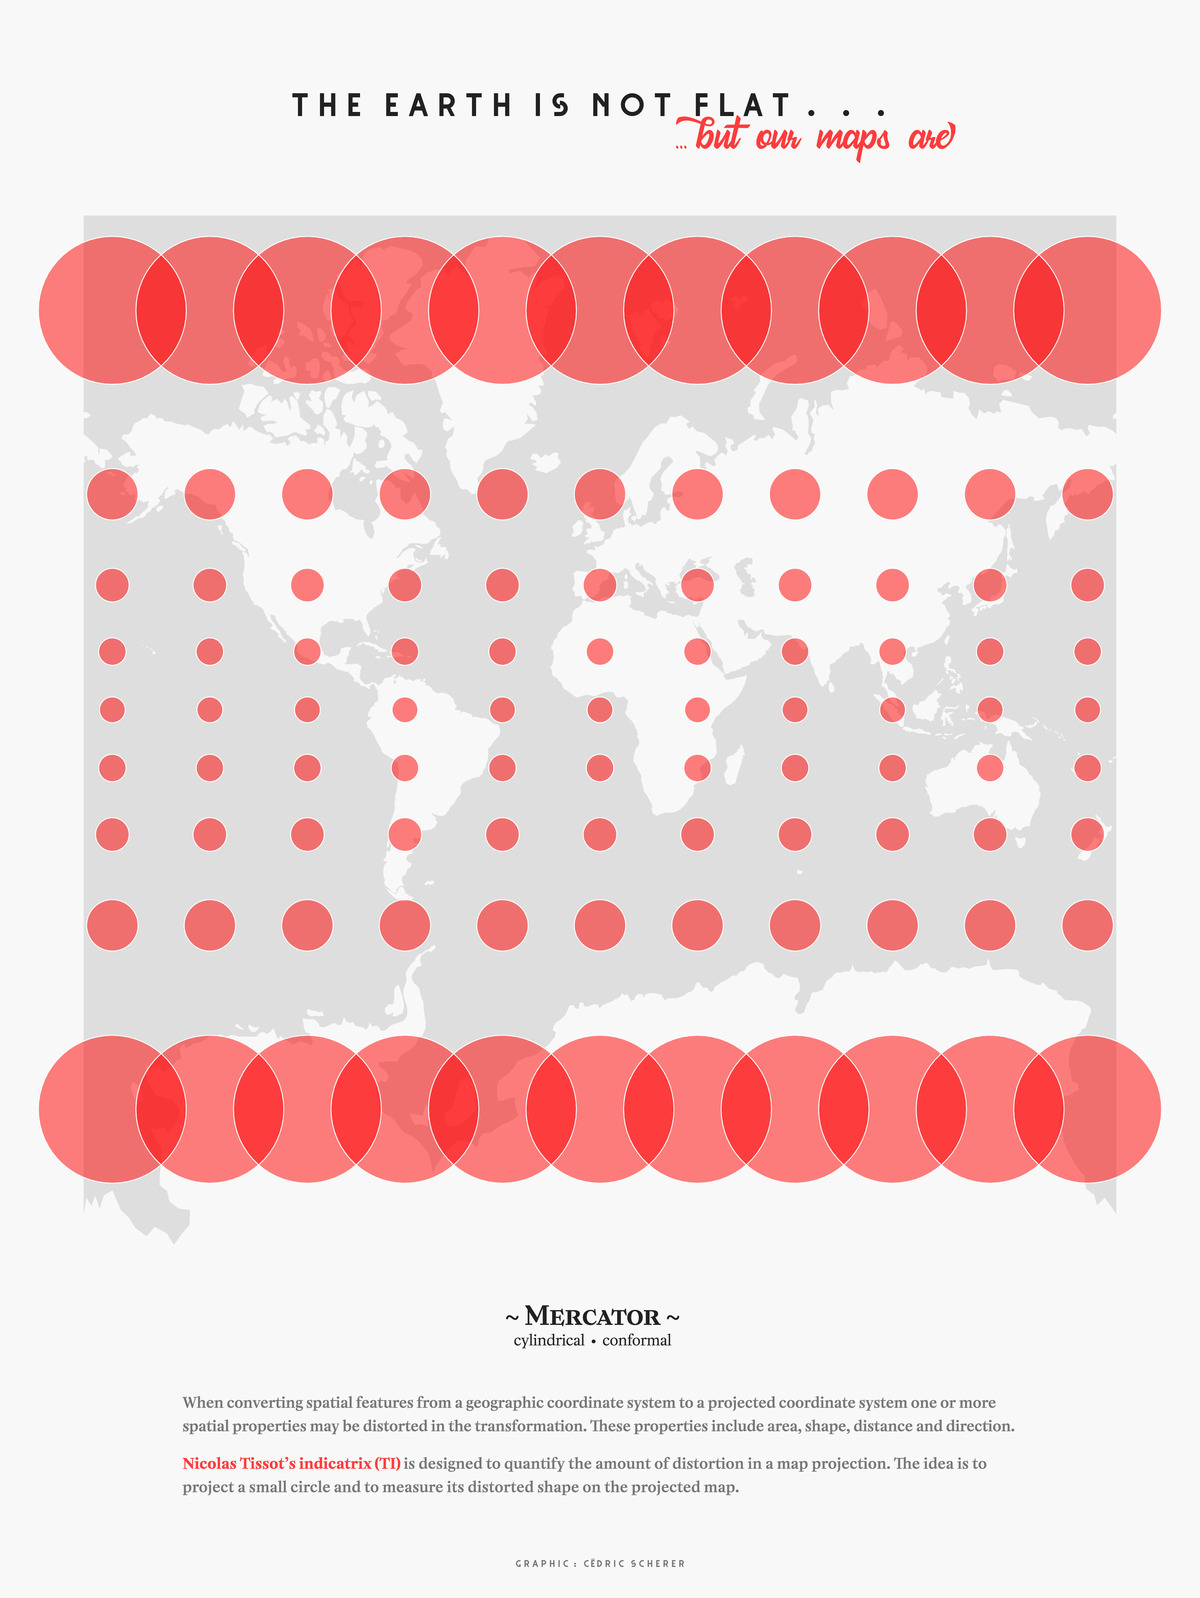
MapChallenge 2021 Day 28 Flat Earth Tissot Indicatrix Mercator Projection
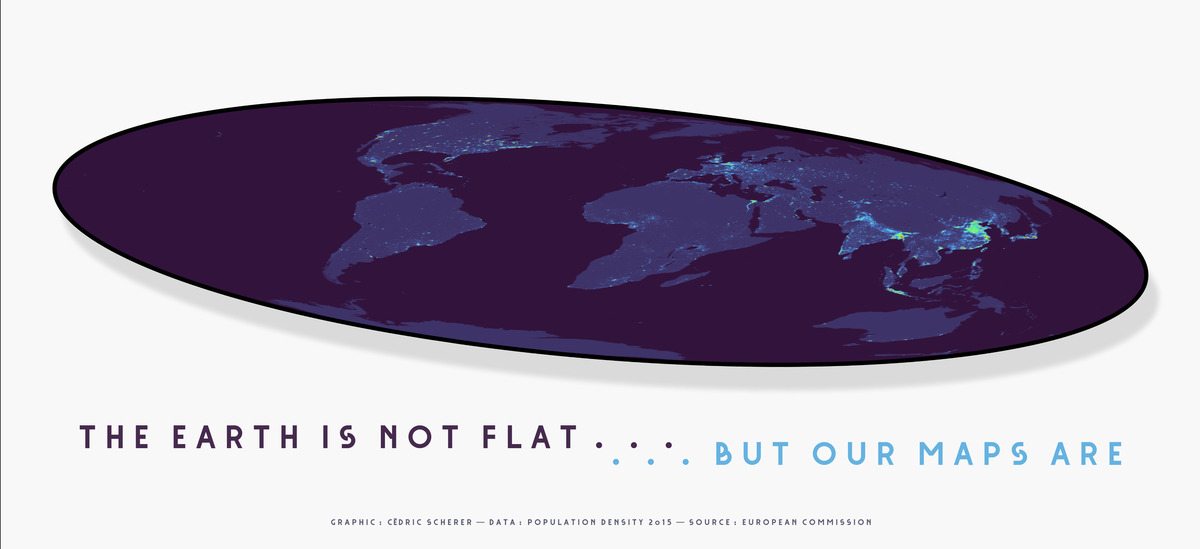
MapChallenge 2021 Day 28 Flat Earth tilted
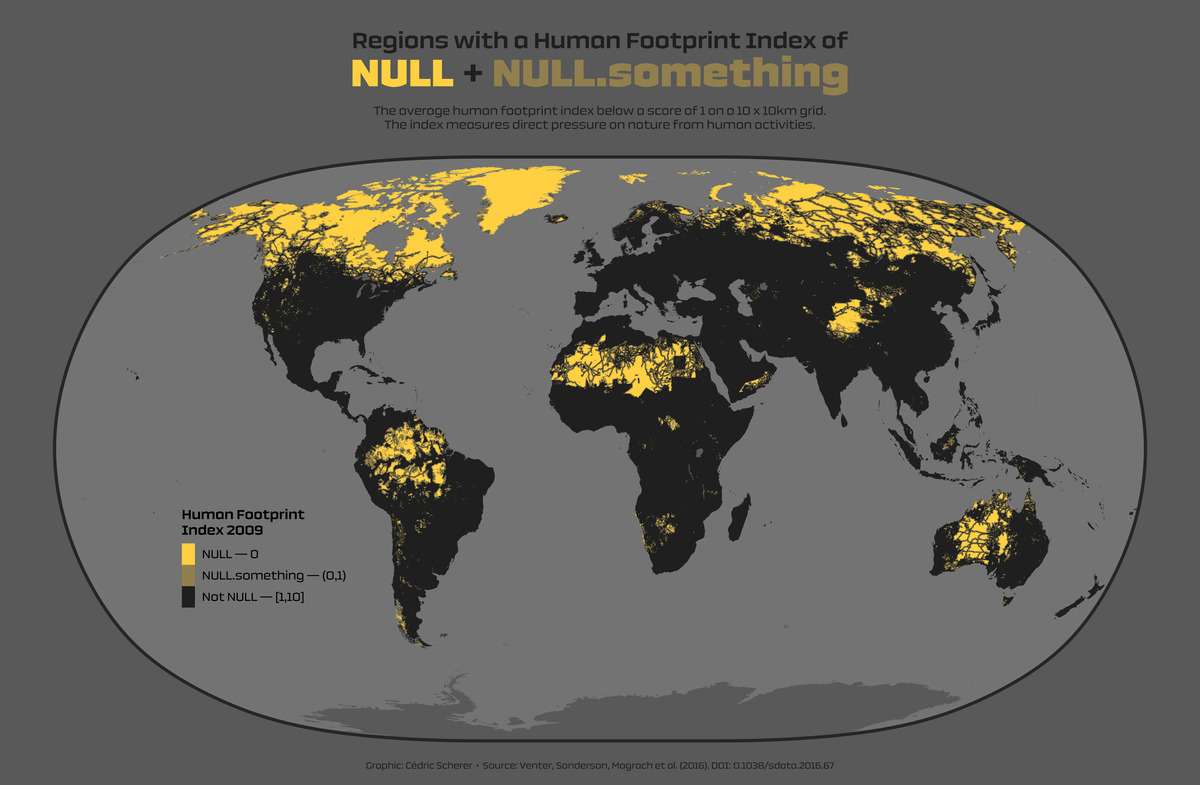
MapChallenge 2021 Day 29 NULL Human Footprint Index 10km

